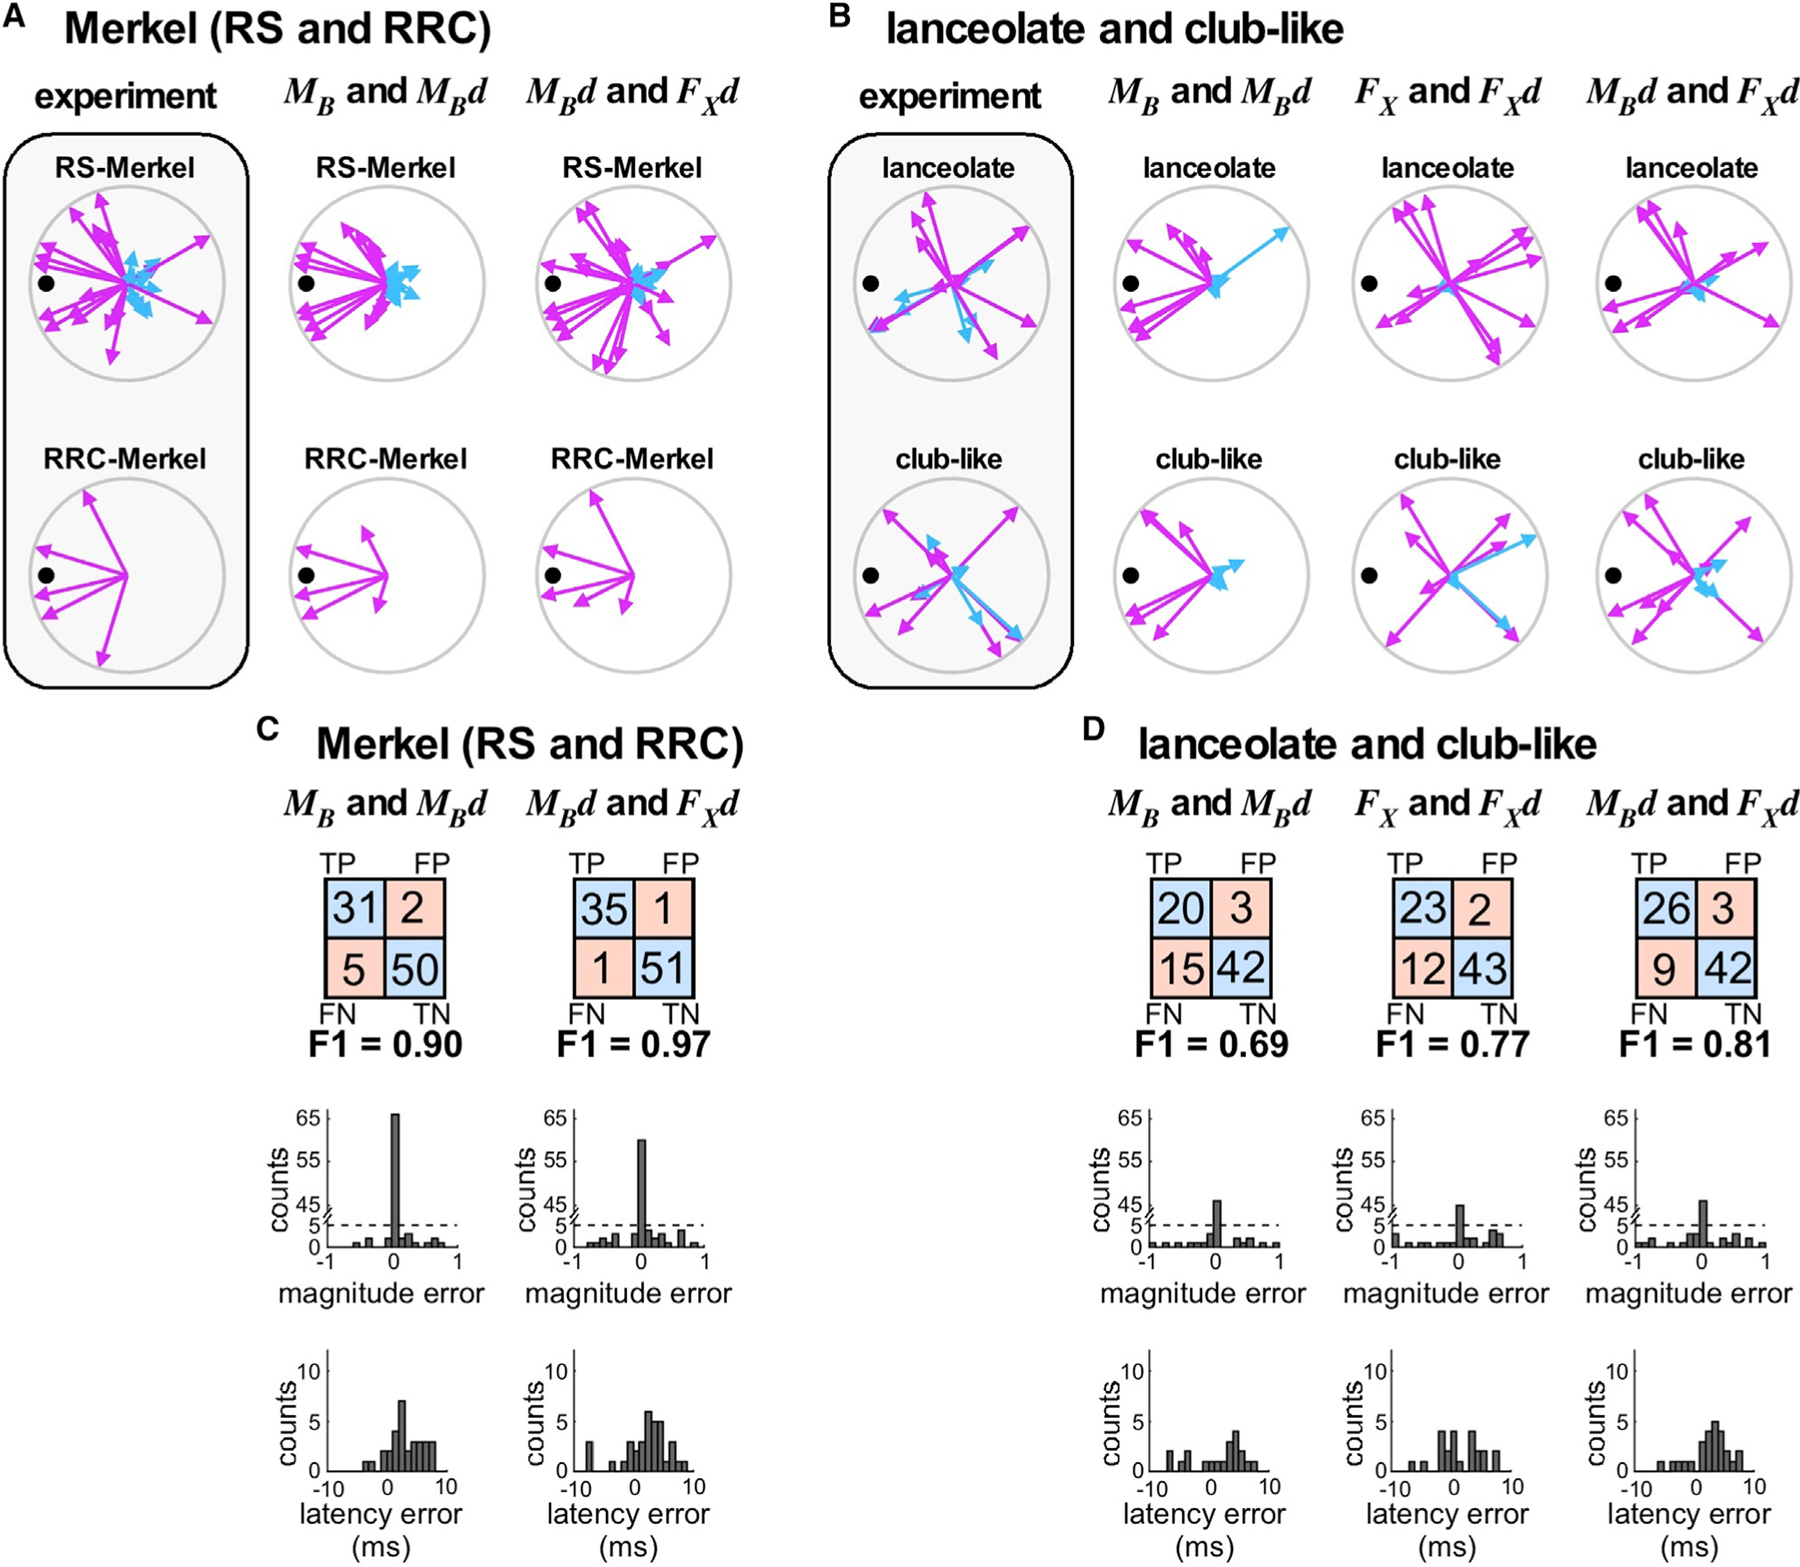
Figure 5. Mechanical Modeling Suggests Differential Mechanical Sensitivities across Afferent Types.

(A) Experimental ON and OFF responses for Merkel neurons.
(B) Experimental ON and OFF responses for lanceolate neurons.
(A and B) Column 1 (shaded) shows experimental data. The remaining columns show results of models based on specific mechanical signals, as labeled. FX , axial force; FX d, derivative of axial force; MB, bending moment; MBd, derivative of bending moment. ON (pink) and OFF (cyan) response magnitudes for each direction are plotted as vectors and sorted by mechanoreceptor type.
(C and D) Confusion matrices and magnitude error and latency error histograms for Merkel (C) and lanceolate and club-like endings (D). Each column shows results for a single modeling choice; abbreviations are as in (A) and (B). Each 2 × 2 array shows the number of true positives (TPs), false positives (FPs), false negatives (FNs), and true negatives (TNs) of predicted spiking responses compared to observed spiking responses. F1 scores (see STAR Methods) are indicated below each array. Histograms quantify error between experimental and modeled stimulus responses. Latency error histograms have 1-ms bins. Magnitude error histograms are binned at 0.1 units, where maximum response magnitude for each afferent has been normalized to 1.
See also Figures S5 and S6.
