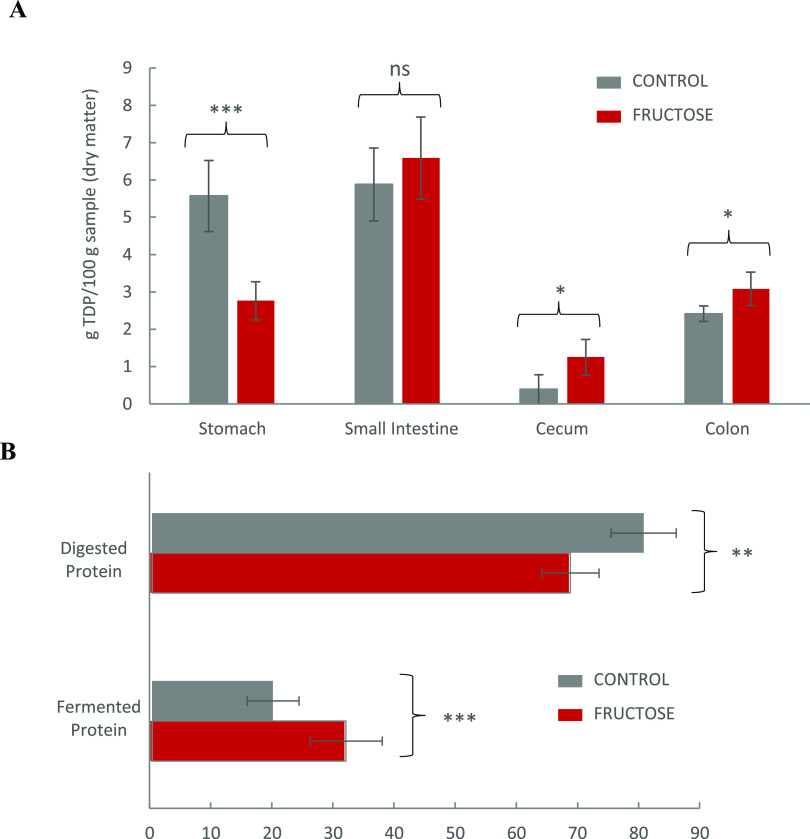
Figure 3.
(A) Amount of total dietary protein (TDP) degradeda at the different compartments of the GIT of from Wistar rats (n = 6 per group) fed ad libitum for 10 weeks with a control base diet and either drinking water (control) or a 30% fructose water solution (fructose). (B) Percentage of TDP digested (degraded in stomach + small intestine) vs percentage of TDP fermented (degraded in cecum + colon) in control and fructose groups. aDegraded TDP at each specific compartment (g) was calculated as (TDP1 – TDP2); where TDP1 is the total concentration of TDP in the immediately previous compartment and TDP2 is the concentration of TDP in the compartment under study in which digestion was assumed finished (samples taken at the end of such stage). For further accuracy, the concentration of protein in each stage was calculated considering the moisture content of feeds and luminal contents at each stage (all protein data are shown as dry matter). For the calculation of protein degradation in the stomach, TDP1 was considered TDP in the feeds, which corresponds to TP in the feed (TN × 6.25), as Ep does not apply in this case for obvious reasons. The pair of means with asterisks is significantly different in Student-t tests. *p < 0.05, **p < 0.01, ***p < 0.001, and ns: no significant differences.

