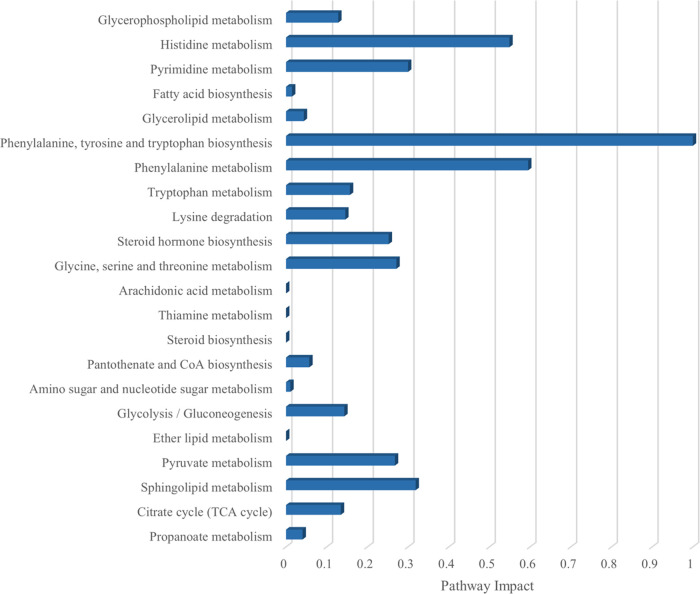
Figure 6.
Categorization of the main pathways resulting from the pathway enrichment analysis (p < 0.005) and the pathway impact values according to the pathway topology analysis, highlighted from the metabolomics analysis of the data from the colonic contents from treated Wistar rats (n = 6 per group), fed ad libitum for 10 weeks with a control base diet and a 30% fructose water solution (fructose) regarding control water-consumer counterparts.

