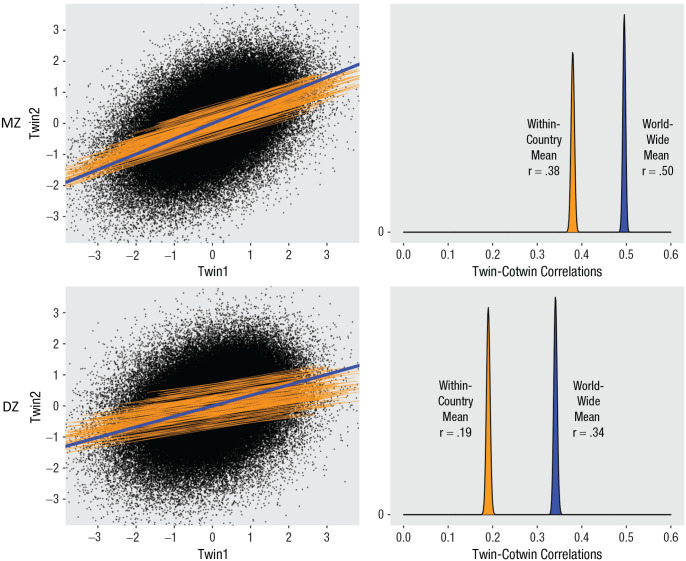
Fig. 2.
Association of well-being for Twin1 and Twin2. Scatterplot (left) with slopes for each country (orange) and worldwide (blue), for monozygotic (MZ) twins (upper) and dizygotic (DZ) twins (lower). Standardized scores. Corresponding distribution plots (right) for within-countries (orange) and worldwide (blue) correlations, for MZ (upper) and DZ (lower), across 100 simulations. Shown values (e.g., .38) are mean r’s across simulations.

