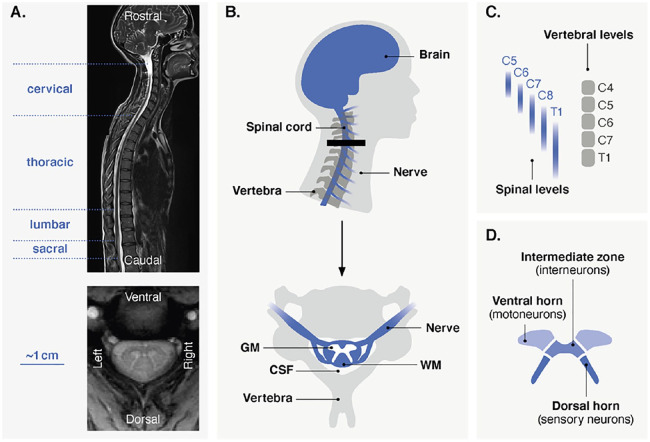
Figure 1.
(A) Anatomical scans of the human spinal cord. The top image shows a sagittal view (T2 imaging), extending from the brain to the lower part of the back. Spinal levels (nerve roots) are divided into four sections, indicated on the left. The bottom image depicts an axial view (T2* imaging) at the cervical level. (B) Schematic representation of the cervical spinal cord. As seen in the sagittal view (top), the spinal cord extends down from the brain. Nerves branch out from the spinal cord and exit superior or inferior to the vertebra. Importantly, nerve roots and vertebrae are not necessarily aligned and can be described using two nomenclatures (see panel C). The thick black line indicates the approximate position of the axial view (bottom) on which the main structures of the spinal cord and its environment are indicated. GM = gray matter; WM = white matter, CSF = cerebrospinal fluid. (C) Correspondence between spinal (nerve roots) and vertebral (bones) levels in the cervical region. For spinal levels, probabilistic maps are shown to highlight the variability over subjects (Cadotte and others 2015). (D) Subdivisions of the gray matter.

