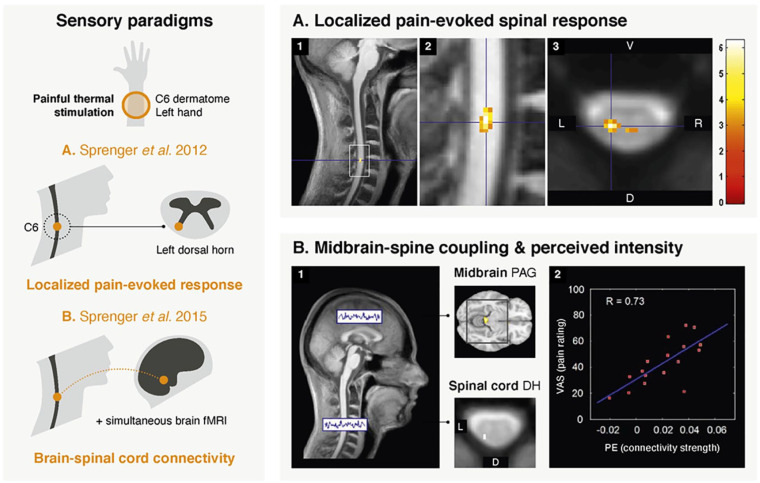
Figure 4.
Examples of spinal cord fMRI studies using sensory paradigms. (A) The first study (adapted with permission from Sprenger and others 2012) used fMRI to look into the spinal cord response to painful thermal stimulation (applied on the left forearm in dermatome C6). Activation maps correspond to group-level (n = 17) pain-related responses. Panels 1 and 2 show these spinal activations overlaid on the mean structural image of all participants (sagittal views). Panel 3 presents an axial view, displayed on top of the mean functional image. The peak of the BOLD response is seen in the ipsilateral dorsal horn of the C6 spinal level, in line with anatomical expectations. The color bar corresponds to t values, with a visualization threshold set at P < .005 (uncorrected). (B) In the second study (adapted with permission from Sprenger and others 2015), a simultaneous spinal-brain fMRI sequence was deployed during low- and high-intensity painful stimulation of the C6 dermatome of the left forearm (n = 17). A spinal-brain functional connectivity analysis was performed (panel 1) using a seed corresponding to the contrast in the spinal cord (i.e., high intensity > low intensity). The seed was located in the left dorsal horn of the C6 spinal level. Couplings were observed with several brain regions, such as the periaqueductal gray matter (PAG). Moreover, the strength of this spinal-PAG coupling was positively correlated (R = 0.73, panel 2) with the individual mean pain ratings, as illustrated in the scatter plot. D = dorsal; PE = parameter estimates; V = ventral; VAS = visual analog scale (for level of pain).

