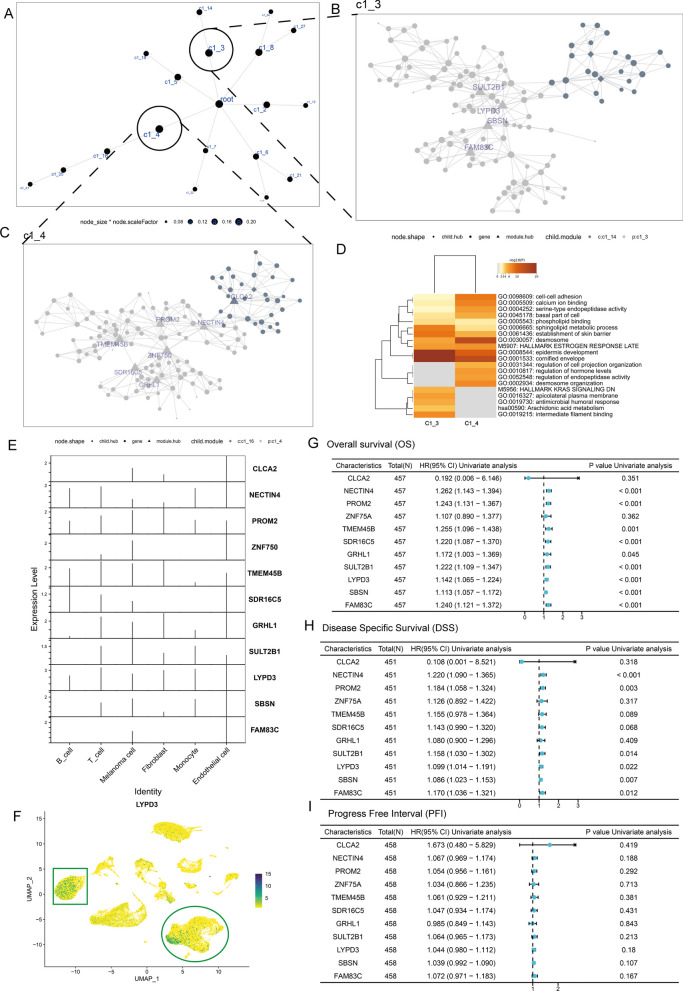
Fig. 3.
Bulk data combined with single-cell data to identify LYPD3 as a study subject. A Co-expression network constructed based on DEGs between C1 and C2. B, C The Multiscale Embedded Gene co-expression Network Analysis (MEGENA) network shows the two largest gene modules. Different colors represent genes in different modules, and triangles represent hub genes in the modules. D GO and KEGG functional enrichment analysis demonstrated shared and unique biological signals of C1_3 and C1_4. E Violin plots show the expression of hub genes in C1_3 and C1_4 across 6 cell types in GSE189889. F UMAP plot showing the expression levels of LYPD3, defined for six cell types. G–I The forest map shows the results of Cox regression analysis on the OS (G), Disease Specific survival (DSS, H), and Progrssion Fre Interval (PFI, I) of 10 hub genes in the TCGA-SKCM cohort

