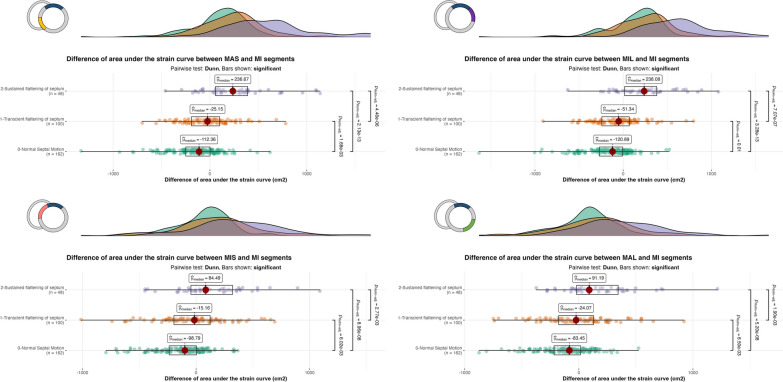
Fig. 3.
Boxplots with density plots showing the difference of area under the strain curves between the MIS and MA segments between 33 and 66% of the cardiac cycle according to the grade of septal motion (grade 0: green; grade 1: orange; grade 2: purple). In each panel, a schematic representation of LV segmentation used for the comparisons is indicated upper left. When compared to the LV MI segment, both the MAS and MIS segments exhibited increased area under the strain curve, according to the severity of paradoxical septal motion. The MIL and MAL strain curves mirrored the abnormal pattern of LV MAS and MIS segmental strain curve, respectively. P value is provided only when significant and adjusted with Benjamini–Hochberg method to take account of the multiplicity of test. LV: left ventricular; MAS: Mid-anteroseptal; MIL: Mid-inferolateral; MA: Mid-anterior; MIS: Mid-infero-septal; MAL: Mid-anterolateral; MI: Mid-inferior

