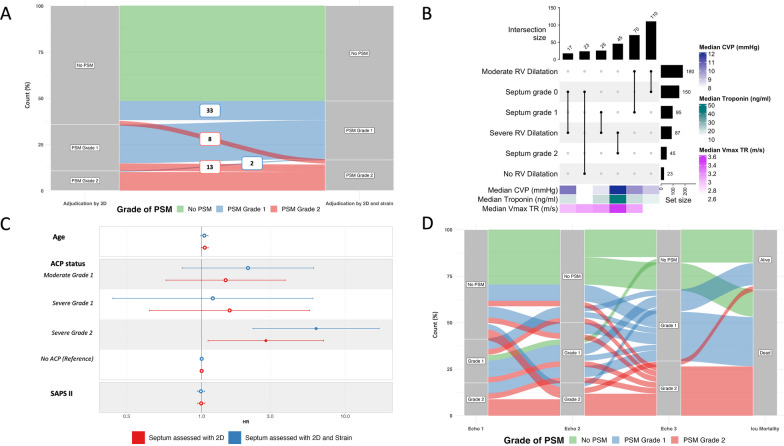
Fig. 4.
A. Alluvial plot depicting the variation of classification for the grade of paradoxical septal motion according to the visual diagnostic approach used (isolated conventional two-dimensional imaging vs. additional left ventricular radial strain; n = 310). Number in boxes correspond to the number of patients who transitioned from grade 0 or 2 to a grade 1 paradoxical septal motion (in blue) or from grade 0 or 1 to a grade 2 paradoxical septal motion (in red). B. Repartition of patients according to the severity of right ventricular dilatation and grade of paradoxical septal motion. Horizontal bars display the number of patients (total of 290 patients, 20 having missing values for RV dilatation assessment) with each of abnormal finding of interest, while the vertical bars depict the different combinations of RV dilatation and grade of septal motion (vertical lines connecting points). Heatmaps show median values of troponin, central venous pressure and maximal velocity of tricuspid regurgitation. C. Forrest plot comparing the multivariate time-dependent Cox model according to the diagnostic approach used (conventional two-dimensional assessment alone or in association with visual left ventricular radial strain interpretation). “Moderate” and “Severe” refer to the severity of right ventricular dilatation, whereas grade 1 or 2 refers to the degree of paradoxical septal motion. D. Alluvial plot obtained in a subset of patients (n = 36) who underwent a least three TEE assessments which allowed to determine the evolution of septal motion during ICU stay and outcome. PSM: paradoxical septal motion; 2D: two-dimensional imaging; TEE: transesophageal echocardiography; RV: right ventricle; CVP: central venous pressure; Vmax TR: maximal velocity of tricuspid regurgitation; ACP: acute cor pulmonale; SAPS II: simplified acute physiology score 2

