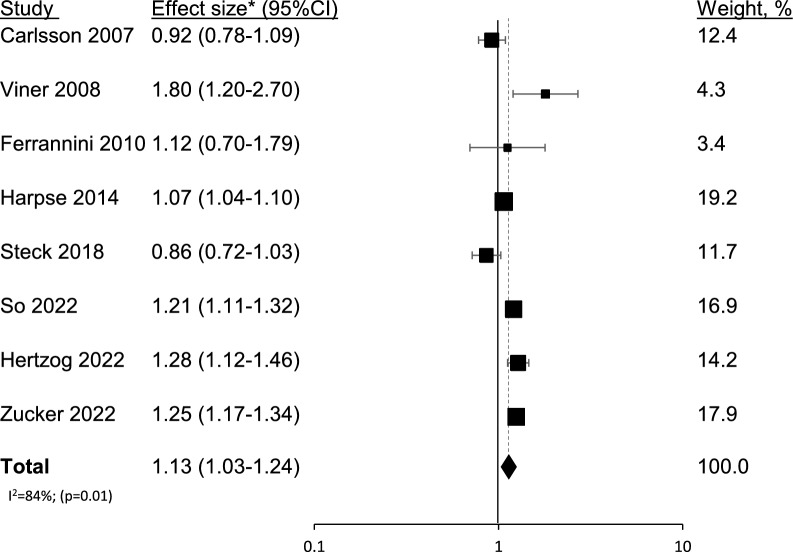
Fig. 3.
Confounder-adjusted size effect (95% CI) for incident type 1 diabetes for 1 BMI unit increment is shown for individual studies and for pooled risk ratio results from the meta-analysis. The sizes of the boxes correspond to the weight of the study in the meta-analysis. The diamond depicts the point estimate (95% CI). The vertical line is centered at the null. This analysis included 8 studies: 3 that used continuous BMI data only, and 5 that used both continuous and categorical data. Instead of Tosur et al. [20], this analysis included So et al. [17], the most recent publication of the TrialNet PTP cohort. *All the studies reported hazard ratios, except Ferrannini [16], who reported risk ratios. The latter provided only a risk ratio stratified by sex, the measure used in this analysis was that reported in men, which was smaller than that reported in women. The calculation using the RR reported in women did not materially change the results [1.15 (1.04–1.28)]

