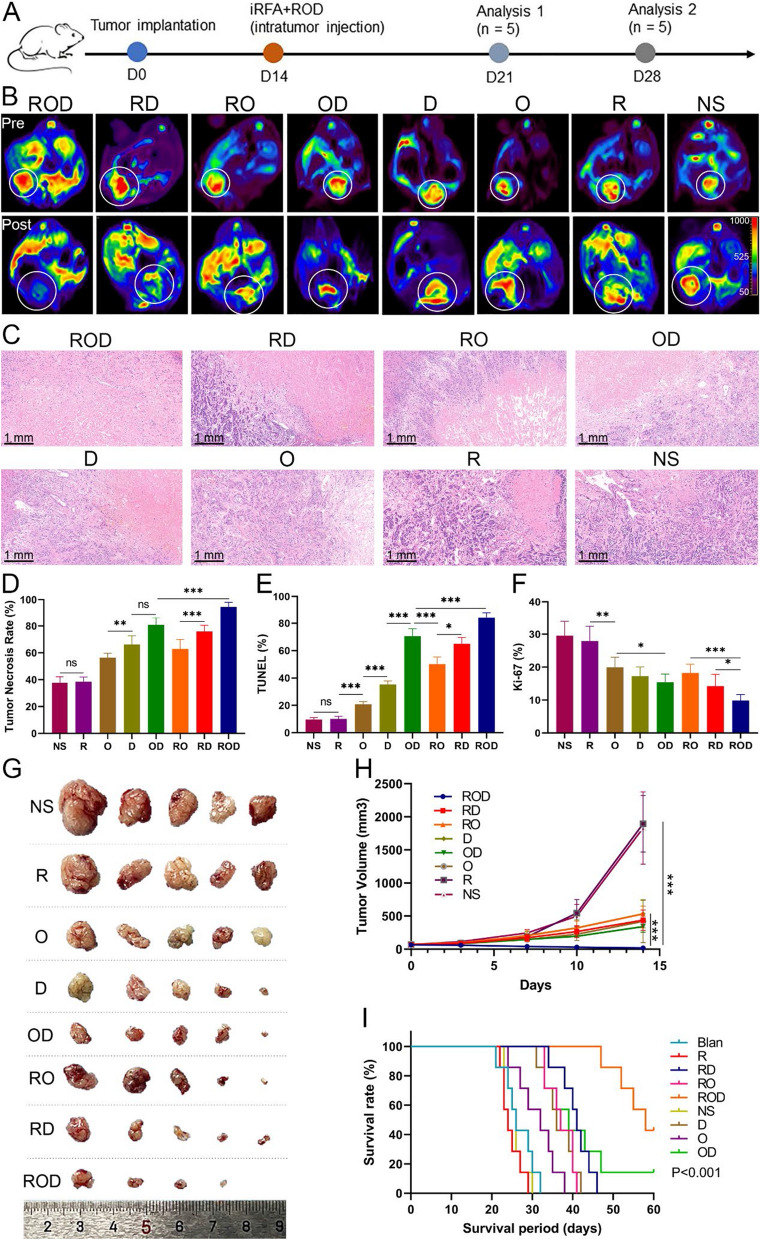
Fig. 2.
Antitumor effect of ROD hydrogel (n = 5). A Treatment schedule of mice bearing HCC. Analysis 1 refers to the evaluation of antitumor immunity, and analysis 2 refers to the evaluation of tumor treatment efficacy. B DWI images exhibiting the residual tumor tissues 14 days after treatments. C Representative HE-stained tumor sections (×10 magnification). D–F Quantitative analysis of tumor necrosis, apoptosis, and proliferation on the basis of HE staining, TUNEL assay, and Ki-67 staining. These results indicated the optimal antitumor effect was achieved in ROD group. G Photograph of dissected tumor samples. H Measurement of tumor volumes at the indicated times. Tumor progression was significantly inhibited in ROD group. I Kaplan–Meier survival curves show that the survival time of mice was significantly longer in the ROD group than in other groups (n = 7). DWI diffusion weighted imaging, NS normal saline; O, OK-432. Ns not significant; *p < 0.05; **p < 0.01; ***p < 0.001

