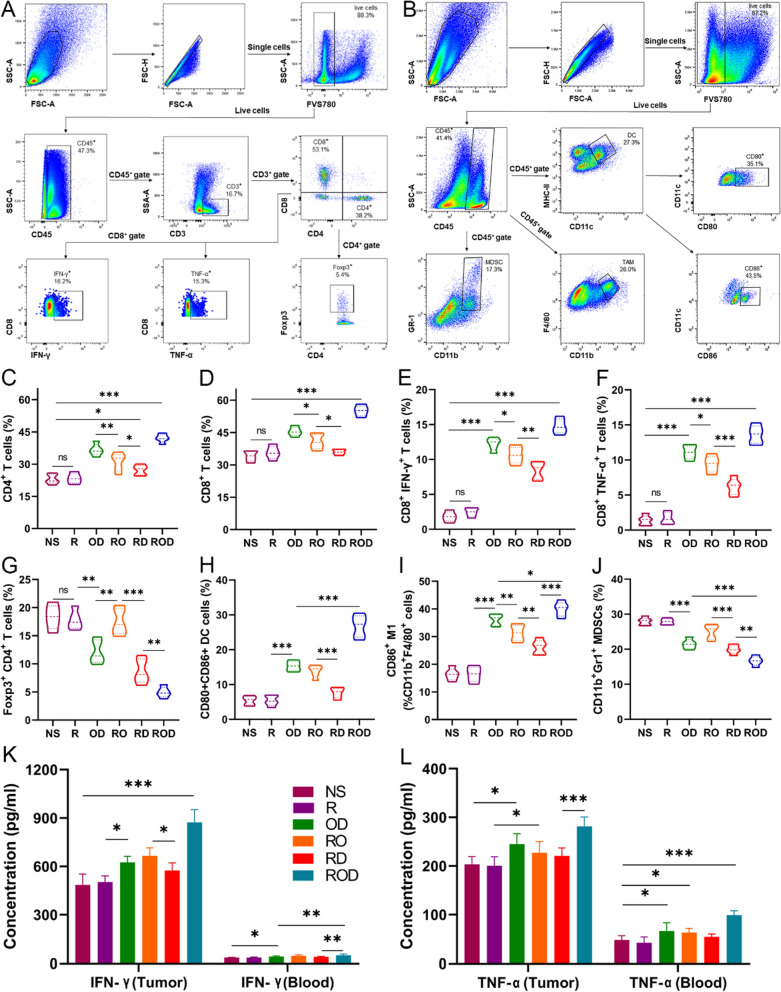
Fig. 3.
Enhanced antitumor immunity after ROD therapy (n = 5). A, B Representative dot plots of the morphological characteristics (SSC vs FSC) of tumors subjected to ROD. Schematic illustration of gating: Tumor-infiltrating lymphocytes were stained with corresponding antibodies for flow cytometric analysis, including CD4+ T, CD8+ T, Treg cells, DCs, TAM, and MDSCs. C–J Quantitative analysis of the percentages of CD4+ T, CD8+ T, Foxp3+CD4+ T, DCs, M1, and MDSCs in tumors 7 days after treatments. K, L Expressions of IFN-γ and TNF-α in tumor tissues and blood. DC dendritic cell, TAM tumor-associated macrophage, MDSCs myeloid-derived suppressor cell, IFN interferon, TNF tumor necrosis factor. Ns not significant; *p < 0.05; **p < 0.01; ***p < 0.001

