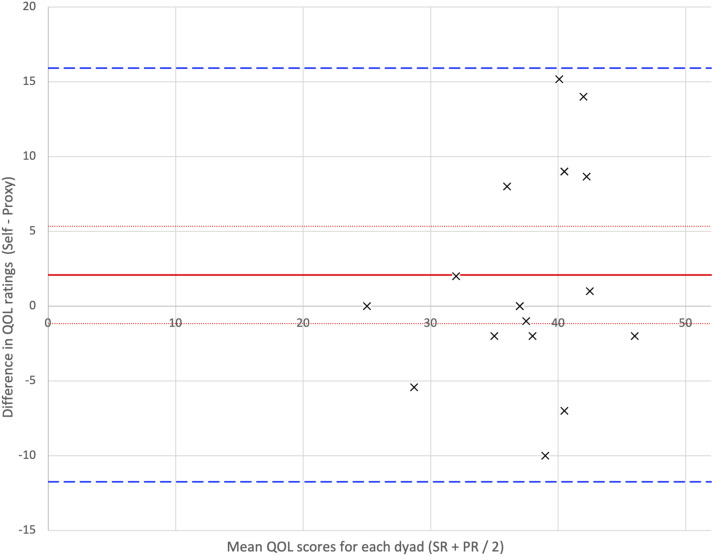
Figure 2.
Bland-Altman plot for QOL-AD total scores rated by people with PPA and proxies. Note: Bias: The average difference between patient and proxy (or ‘bias’) is indicated by the red line with accompanying confidence intervals (dotted red lines). A difference of 0 (the x-axis) would indicate perfect agreement. If the x-axis falls outside of the confidence interval of the bias, this would indicate significant rater bias is occurring; significant rater bias is not seen in this plot. Agreement: Limits of agreement (green dashed lines) indicate the area from +1.96 SD to -1.96 SD, within which 95% of the data lie, and require clinical interpretation.

