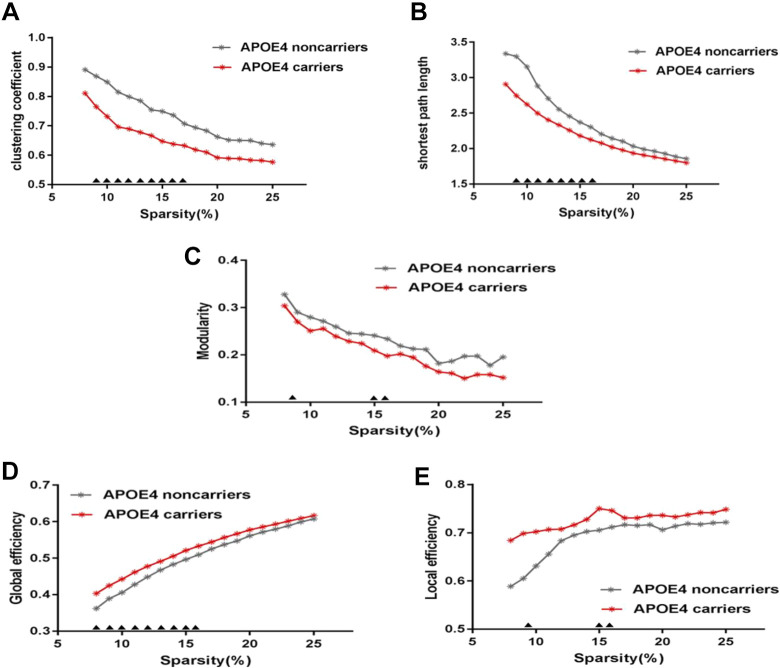
Figure 2.
PHF-Tau network at different sparsity for APOE 4 carriers (the red line) and APOE 4 noncarriers (the gray line) and their statistical comparison results (p < 0.05 5000 permutation test, FDR correction). (A) clustering coefficient, (B) shortest path lenth, (C) Modularity, (D) global effciency, (E) local effciency. The black triangles indicate a significant group difference.

