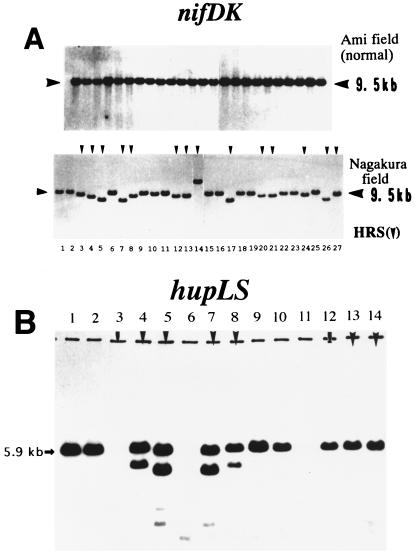
FIG. 1.
Autoradiogram showing Southern blot hybridization of HRS and normal isolates of B. japonicum with nifDK (A) and hupLS (B). The arrowhead in the lanes and an asterisk in the designations below indicate an HRS isolate. (A) All isolates from the Ami field showed a consistent 9.5-kb band that hybridized with nifDK (top panel), whereas HRS isolates from the Nagakura field showed a shift of nifDK-specific hybridization bands below and above the 9.5-kb band (arrowheads, bottom panel). Each lane contained HindIII-digested total DNA from the following isolates: USDA110 (lane 1), NK2 (lane 2), NK4* (lane 3), NK5* (lane 4), NK6* (lane 5), NK8* (lane 6), NK9* (lane 7), NK10* (lane 8), NK13 (lane 9), NK14 (lane 10), NK15 (lane 11), NK16* (lane 12), NK18* (lane 13), NK20* (lane 14), NK21 (lane 15), NK23 (lane 16), NK25* (lane 17), NK26 (lane 18), NK28a (lane 19), NK28b* (lane 20), NK29* (lane 21), NK30 (lane 22), NK32 (lane 23), NK34* (lane 24), NK35 (lane 25), NK37* (lane 26), and NK40* (lane 27). (B) The HindIII-digested DNA of HRS isolates from the Nagakura field showed a duplex of bands of hupLS-specific hybridization. Isolates corresponding to lane numbers are the same as in panel A. NK5* (lane 4) and NK10* (lane 8) showed 5.8- and 4.9-kb bands of hupLS-specific hybridization. NK6* (lane 5) and NK9* (lane 7) showed 5.7- and 4.6-kb bands.

