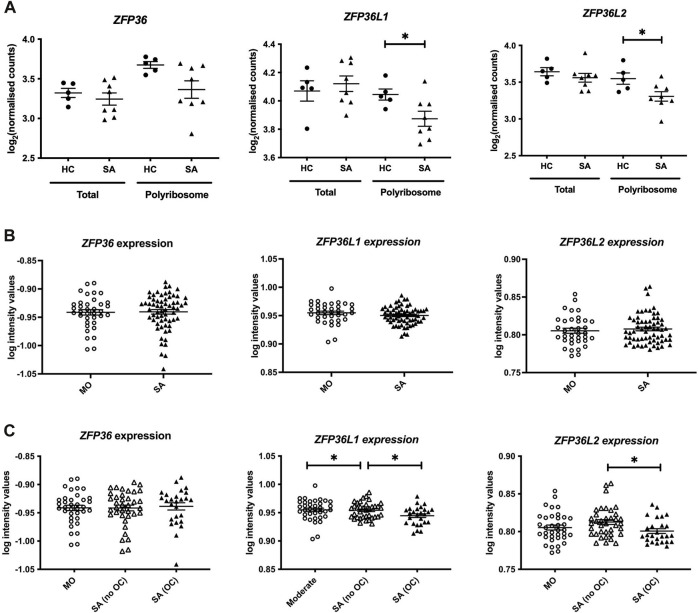
FIGURE 1.
Analysis of the expression of the TTP family in human bronchial epithelial samples. (A) Frac-seq data showing the log counts for ZFP36, ZFP36L1 and ZFP36L2 in bronchial epithelial cells from severe asthma (SA, n = 8) vs. healthy control (HC, n = 5) donors from (Martinez-Nunez et al., 2018) in total mRNA (Total) or polyribosome-bound mRNA (Polyribosome). (B) Analysis of GSE76227 dataset from U-BIOPRED showing the log intensity values of microarrays in bronchial brushings from patients with moderate (MO) and severe asthma (SA). (C) Analysis of GSE76227 dataset from U-BIOPRED showing the log intensity values of microarrays in bronchial brushing from patients with moderate (MO, n = 36), severe asthma on oral corticoids (SA (OC), n = 26) and severe asthma on inhaled GCs (SA (no OC)), n = 37). Statistical significance was assessed by two-tailed t-tests on log transformed data. *p < 0.05.

