FIGURE 2.
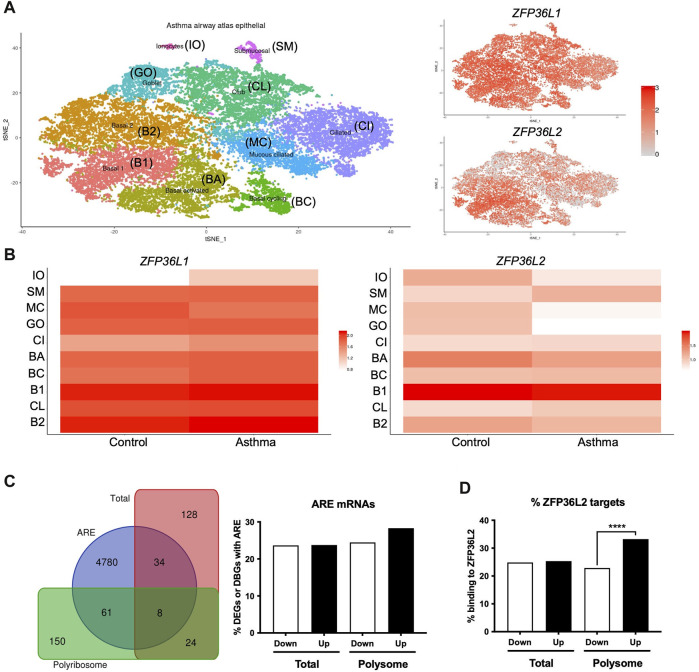
Airway epithelial cell-specific patterns of ZFP36L1 and ZFP36L2 mRNA expression and ZFP36L2 targets’ behaviour in severe asthma. (A) t-Distributed Stochastic Neighbor Embedding (t-SNE) plots representing the different airway epithelial cell types present in very mild asthma as per (Vieira Braga et al., 2019) (left), with ZFP36L1 and ZFP36L2 mRNA expression patterns represented on the tSNE’s on the right. (B) Relative expression ZFP36L1 and ZFP36L2 mRNA levels between health and asthma per airway epithelial cell type. IO: Ionocytes, SM: Submucosal, MC: Mucous ciliated, GO: Goblet, CI: Ciliated, BA: Basal activated, BC: Basal Cycling, B1: Basal 1, CL: Club, B2: Basal 2. (C) Left: Venn diagram representing the overlap of differentially expressed genes (DEGs in Total, red) or differentially bound genes (DBGs in Polyribosome, green) containing AU-rich element (ARE, blue) (Bakheet et al., 2018) when comparing health vs. severe asthma. Right: bar plot showing the proportion and direction of changes (Up or Downregulated) of ARE-containing mRNAs in DEGs and DBGs when comparing health vs. severe asthma. (D) Bar plot showing the proportion of ZFP36L2 targets as per (Zhang et al., 2013) present per subcellular fraction in our Frac-seq health vs. severe asthma dataset. Statistics were done employing a two-sided Chi-square test. ****: p < 0.0001.

