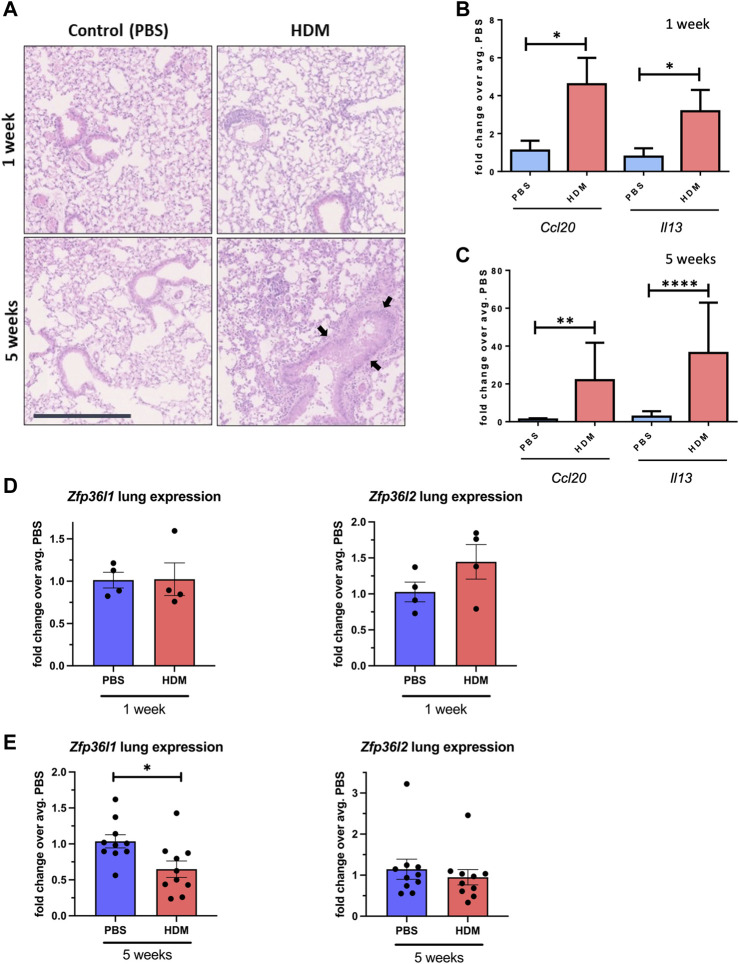
FIGURE 3.
Zfp36l1 and Zfp36l2 mRNA expression in the lungs different mouse models of asthma. (A) Representative images of Hematoxilyn and Eosin (H and E) staining of FFPE lung sections from mice treated with PBS as a control or with HDM for different times as indicated in the figure. Scale bars 125 μm. (B). The expression of two cytokines (Ccl20 and Il13) in whole lung mRNA was analyzed by quantitative qPCR for 1 week and in (C) for 5 weeks. Bar graphs represent mean fold change (±SEM) over the average PBS-treated control (n = 3 mice per group at PBS/HDM for 1 week and n = 5 mice per group in 3 independent experiments for the 5 weeks treatment). (D) Expression of both Zfp36l1 and Zfp26l2 in whole lung mRNA analysed by quantitative PCR for 1 week and in (E) for 5 weeks. Bar graphs represent mean fold change (±SEM) over the average PBS-treated control (n = 3 mice per group at PBS/HDM for 1 week and n = 5 mice per group in 3 independent experiments for the 5 weeks treatment). Statistical significance was assessed by multiple two-tailed parametric t-tests on log transformed data. p < 0.05*, p < 0.01**, p < 0.001*** and p ≤ 0.0001****. Black arrows point towards increased epithelium height.

