FIGURE 3.

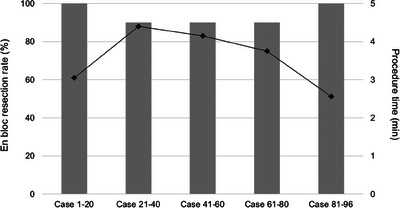
Chronological changes in en bloc resection rate and procedure time in the underwater endoscopic mucosal resection (UEMR) group. The bar chart shows the en bloc resection rate, and the line chart shows the procedure time.

Chronological changes in en bloc resection rate and procedure time in the underwater endoscopic mucosal resection (UEMR) group. The bar chart shows the en bloc resection rate, and the line chart shows the procedure time.