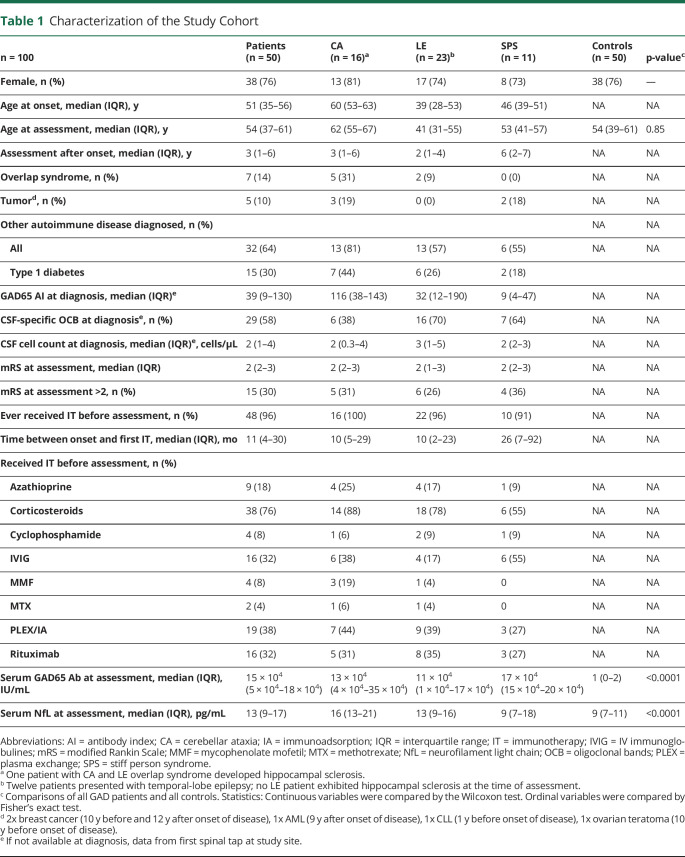
Table 1.
Characterization of the Study Cohort
| n = 100 | Patients (n = 50) | CA (n = 16)a | LE (n = 23)b | SPS (n = 11) | Controls (n = 50) | p-valuec |
| Female, n (%) | 38 (76) | 13 (81) | 17 (74) | 8 (73) | 38 (76) | — |
| Age at onset, median (IQR), y | 51 (35–56) | 60 (53–63) | 39 (28–53) | 46 (39–51) | NA | NA |
| Age at assessment, median (IQR), y | 54 (37–61) | 62 (55–67) | 41 (31–55) | 53 (41–57) | 54 (39–61) | 0.85 |
| Assessment after onset, median (IQR), y | 3 (1–6) | 3 (1–6) | 2 (1–4) | 6 (2–7) | NA | NA |
| Overlap syndrome, n (%) | 7 (14) | 5 (31) | 2 (9) | 0 (0) | NA | NA |
| Tumord, n (%) | 5 (10) | 3 (19) | 0 (0) | 2 (18) | NA | NA |
| Other autoimmune disease diagnosed, n (%) | NA | NA | ||||
| All | 32 (64) | 13 (81) | 13 (57) | 6 (55) | NA | NA |
| Type 1 diabetes | 15 (30) | 7 (44) | 6 (26) | 2 (18) | ||
| GAD65 AI at diagnosis, median (IQR)e | 39 (9–130) | 116 (38–143) | 32 (12–190) | 9 (4–47) | NA | NA |
| CSF-specific OCB at diagnosise, n (%) | 29 (58) | 6 (38) | 16 (70) | 7 (64) | NA | NA |
| CSF cell count at diagnosis, median (IQR)e, cells/μL | 2 (1–4) | 2 (0.3–4) | 3 (1–5) | 2 (2–3) | NA | NA |
| mRS at assessment, median (IQR) | 2 (2–3) | 2 (2–3) | 2 (1–3) | 2 (2–3) | NA | NA |
| mRS at assessment >2, n (%) | 15 (30) | 5 (31) | 6 (26) | 4 (36) | NA | NA |
| Ever received IT before assessment, n (%) | 48 (96) | 16 (100) | 22 (96) | 10 (91) | NA | NA |
| Time between onset and first IT, median (IQR), mo | 11 (4–30) | 10 (5–29) | 10 (2–23) | 26 (7–92) | NA | NA |
| Received IT before assessment, n (%) | ||||||
| Azathioprine | 9 (18) | 4 (25) | 4 (17) | 1 (9) | NA | NA |
| Corticosteroids | 38 (76) | 14 (88) | 18 (78) | 6 (55) | NA | NA |
| Cyclophosphamide | 4 (8) | 1 (6) | 2 (9) | 1 (9) | NA | NA |
| IVIG | 16 (32) | 6 [38) | 4 (17) | 6 (55) | NA | NA |
| MMF | 4 (8) | 3 (19) | 1 (4) | 0 | NA | NA |
| MTX | 2 (4) | 1 (6) | 1 (4) | 0 | NA | NA |
| PLEX/IA | 19 (38) | 7 (44) | 9 (39) | 3 (27) | NA | NA |
| Rituximab | 16 (32) | 5 (31) | 8 (35) | 3 (27) | NA | NA |
| Serum GAD65 Ab at assessment, median (IQR), IU/mL | 15 × 104 (5 × 10⁴–18 × 104) | 13 × 104 (4 × 10⁴–35 × 104) | 11 × 104 (1 × 10⁴–17 × 104) | 17 × 104 (15 × 104–20 × 104) | 1 (0–2) | <0.0001 |
| Serum NfL at assessment, median (IQR), pg/mL | 13 (9–17) | 16 (13–21) | 13 (9–16) | 9 (7–18) | 9 (7–11) | <0.0001 |
Abbreviations: AI = antibody index; CA = cerebellar ataxia; IA = immunoadsorption; IQR = interquartile range; IT = immunotherapy; IVIG = IV immunoglobulines; mRS = modified Rankin Scale; MMF = mycophenolate mofetil; MTX = methotrexate; NfL = neurofilament light chain; OCB = oligoclonal bands; PLEX = plasma exchange; SPS = stiff person syndrome.
One patient with CA and LE overlap syndrome developed hippocampal sclerosis.
Twelve patients presented with temporal-lobe epilepsy; no LE patient exhibited hippocampal sclerosis at the time of assessment.
Comparisons of all GAD patients and all controls. Statistics: Continuous variables were compared by the Wilcoxon test. Ordinal variables were compared by Fisher's exact test.
2x breast cancer (10 y before and 12 y after onset of disease), 1x AML (9 y after onset of disease), 1x CLL (1 y before onset of disease), 1x ovarian teratoma (10 y before onset of disease).
If not available at diagnosis, data from first spinal tap at study site.

