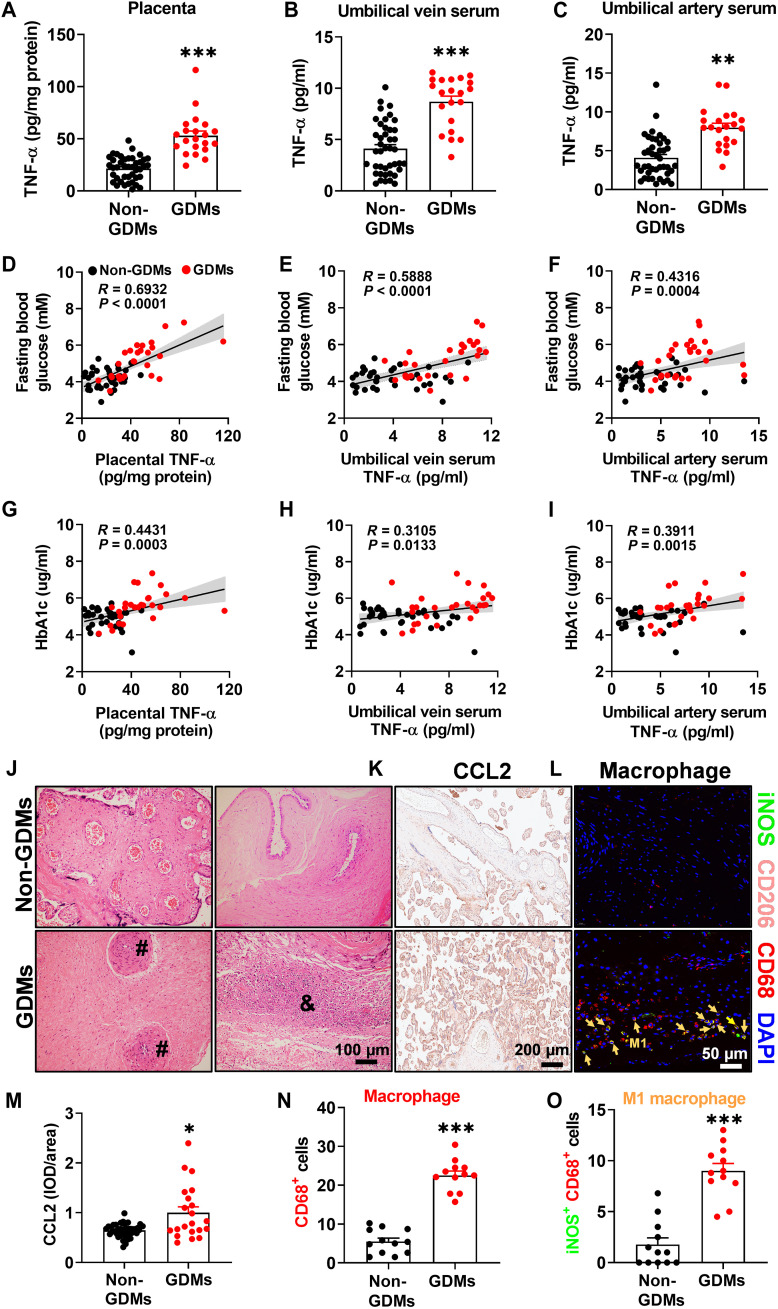
Fig. 1. Relationship between placental inflammation (TNF-α) and abnormal glucose metabolism in GDM women.
(A to C) TNF-α levels in the placenta and umbilical veins and arteries. Non-GDMs, n = 42; GDMs, n = 21. (D to F) Two-tailed Pearson’s correlation coefficient analysis of TNF-α levels in the placenta, umbilical vein serum, and artery serum in terms of fasting glucose levels. (G to I) Two-tailed Pearson’s correlation coefficient analysis of TNF-α levels in the placenta, umbilical vein serum, and artery serum in terms of blood HbA1c levels. (J) Representative hematoxylin and eosin (H&E)–staining images of midsagittal placental tissue sections used in histomorphological analysis. Placental inflammatory cell infiltration (&) and vascular infarction (#). See table S1 for quantification of H&E staining. Non-GDMs, n = 42; GDMs, n = 21. Scale bar, 100 μm. (K and M) Immunohistochemistry and quantification of CCL2 in placenta. Non-GDMs, n = 42; GDMs, n = 21. Scale bar, 200 μm. IOD, integrated optical density. (L, N, and O) Localization of macrophage (CD68+; red), M1 macrophage (iNOS+/CD68+; green/red; yellow arrow), and M2 macrophage (CD206+/CD68+; pink/red; it was not quantified because it was almost nonexistent) in placenta by immunofluorescence. Non-GDMs, n = 12; GDMs, n = 12. Scale bar, 50 μm. DAPI, 4′,6-diamidino-2-phenylindole. Data were analyzed by unpaired Student’s t test (A and M to O) or Mann-Whitney U test (B and C) and represented the means ± SEM. *P < 0.05, **P < 0.01, and ***P < 0.001.

