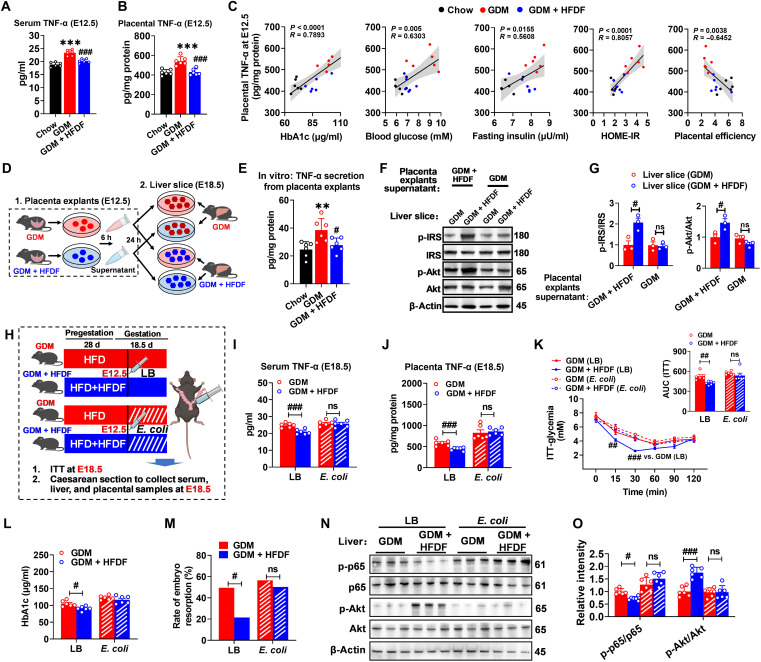
Fig. 4. The central role of HFDF in hindering GDM development by suppressing placental inflammation.
(A and B) Serum (n = 6 mice per group) and placental (n = 6 placentae from 6 litters per group) TNF-α levels E12.5. Schematic of the maternal diet regimen and breeding is shown in Fig. 2A. (C) Two-tailed Pearson’s correlation coefficient analysis of placental TNF-α levels and GDM parameters in E12.5 mice. (D) Schematic representation of primary liver sections treated with placental explant supernatant. Results represent two independent experiments. (E) TNF-α levels in culture supernatants derived from placental explants (n = 6 placenta from 6 litters per group). (F and G) Immunoblots and quantification of insulin signaling pathway (p-IRS/IRS and p-Akt/Akt) in liver slices (n = 3 liver from 3 mice per group). (H) Schematic representation for placental inflammation induction. (I and J) Serum and placental TNF-α levels of GDM, or GDM + HFDF mice at 6 days after placental inflammation induction treatment (at E18.5) (n = 6 mice per group). (K) ITT and AUC of GDM or GDM + HFDF mice at E18.5 (n = 6 mice per group). (L) Serum HbA1c level of GDM or GDM + HFDF mice at E18.5 (n = 6 mice per group). (M) Rate of embryo resorption in each group (n = 6 litters per group). (N and O) Immunoblots and quantification of p-p65/p65 and p-Akt/Akt in livers of GDM or GDM + HFDF mice at E18.5 (n = 6 placentae from 6 litters per group). Data were analyzed by one-way ANOVA followed by post hoc Tukey’s tests [(A), (B), and (E)] and two-way ANOVA followed by post hoc Bonferroni tests [(G) to (L) and (O)] or chi-square test (M) and represented means ± SEM. #P < 0.05, ** or ##P < 0.01, *** or ###P < 0.001, and ns (not significant), relative to chow and GDM group, respectively.

