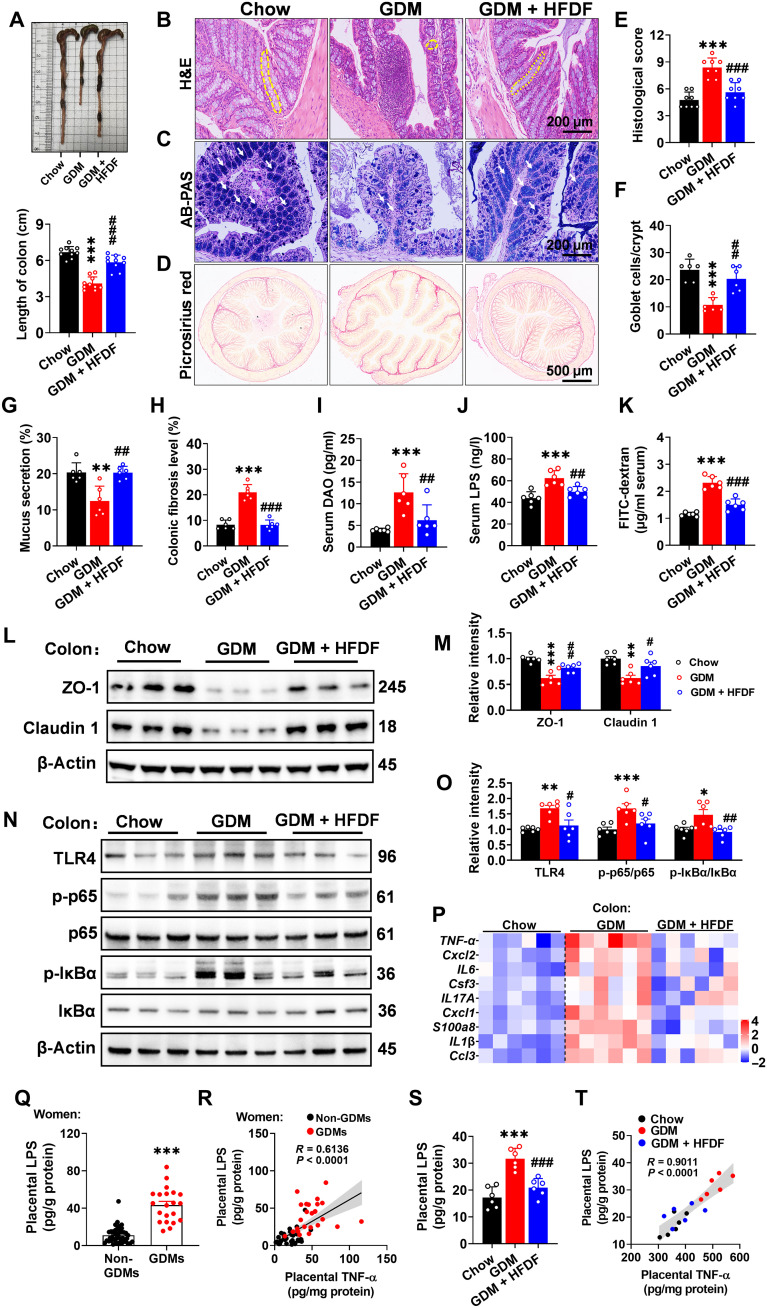
Fig. 5. Effects of HFDF on placental inflammation associated with impaired gut barrier and placental bacterial components (LPS) translocation in GDM model.
Schematic of the maternal diet regimen and breeding is shown in Fig. 2A. At E18.5, serum and intestinal samples were obtained after execution of mice. (A) Representative colon images and colon length (n = 10 mice per group). (B, E, and F) Representative H&E staining images of colon sections, histological score, and goblet cell (yellow dashed lines) number per colonic crypt (n = 6 mice per group). Scale bar, 200 μm. (C and G) Representative Alcian blue–periodic acid Schiff (AB-PAS) staining images of colon sections and quantification of mucus secretion (white arrows) (n = 6 mice per group). Scale bar, 200 μm. (D and H) Representative Picrosirius red of colon sections and quantification (n = 6 mice per group). (I to K) Serum DAO, LPS, and FITC-dextran flux levels (n = 6 mice per group). FITC-dextran flux was analyzed in another independent experiment. (L to O) Immunoblots and quantification of barrier-forming tight junction markers and TLR4/NF-κB inflammatory pathway in colon (n = 6 mice per group). (P) 4 Expression levels of cytokines and inflammatory-related factors in placenta (n = 6 mice per group). (Q) Placental LPS level in women (non-GDMs, n = 42; GDMs, n = 21). (R) Two-tailed Pearson’s correlation coefficient analysis of placental LPS levels and placental TNF-α in women. (S) Placental LPS level in mice (n = 6 placentae from 6 litters per group). (T) Two-tailed Pearson’s correlation coefficient analysis of placental LPS levels and placental TNF-α in mice. Data were analyzed by one-way ANOVA followed by post hoc Tukey’s tests (A to P and S) or unpaired Student’s t test with Welch’s correction (Q) and represented means ± SEM. *P < 0.05, **P < 0.01, and ***P < 0.001, relative to chow group or non-GDM. #P < 0.05, ##P < 0.01, and ###P < 0.001, relative to GDM group.

