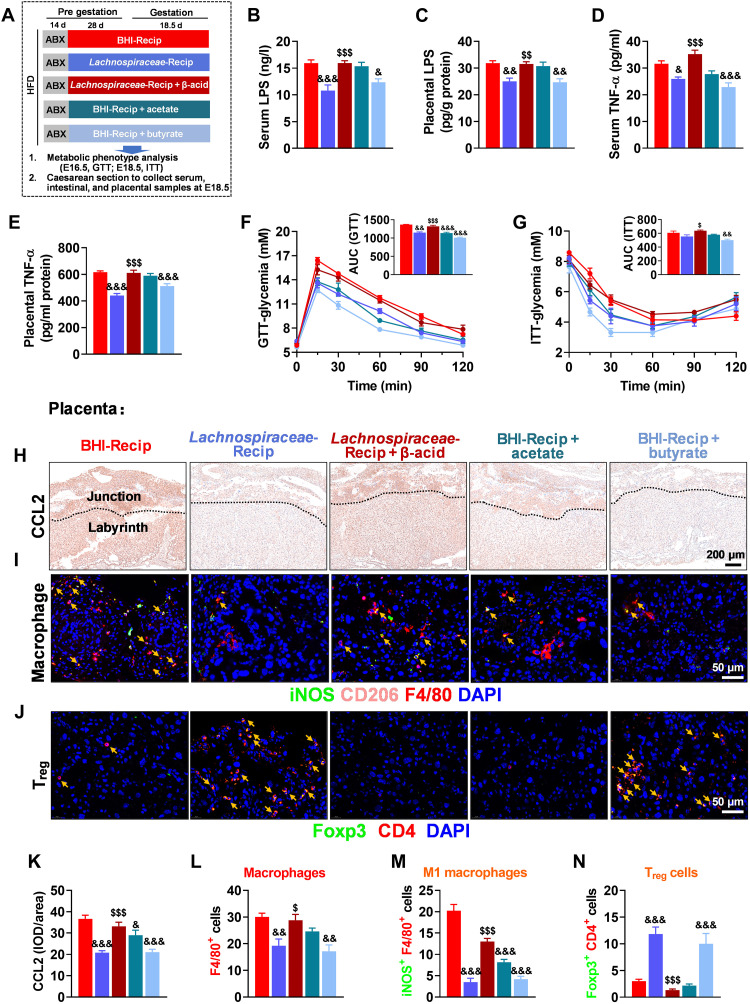
Fig. 8. Effects of Lachnospiraceae and SCFAs on HFD-induced placental inflammation and GDM development.
(A) Schematic of medium control [brain-heart infusion (BHI)], transfer experiments with bacteria (Lachnospiraceae), Lachnospiraceae + β-acid (an inhibitor of bacterial SCFA production), acetate, or butyrate. At E18.5, serum, intestinal, and placental samples were obtained after execution of mice (n = 6 mice per group). (B and C) Serum and placental LPS level (n = 6 mice per group). (D and E) Serum and placental TNF-α level (n = 6 mice per group). (F) GTT and AUC (n = 6 mice per group). (G) ITT and AUC (n = 6 mice per group). (H and K) Immunohistochemistry and quantification of CCL2 (one of the key factors in macrophage recruitment) in placenta (n = 6 placentae from 6 litters per group). Scale bar, 200 μm. (I, L, and M) Localization of macrophage (F4/80+; red), M1 macrophage (iNOS+/F4/80+; green/red; yellow arrow), and M2 macrophage (CD206+ F4/80+; pink/red; it was not quantified because it was almost nonexistent) in placenta by immunofluorescence (n = 6 placentae from 6 litters per group). Scale bar, 50 μm. (J and N) Localization of Treg cell (Foxp3+/CD4+; yellow arrow) in placenta by immunofluorescence (n = 6 placentae from 6 litters per group). Scale bar, 50 μm. Data were analyzed by one-way ANOVA followed by post hoc Tukey’s tests (B to E, AUC, and K to N) or two-way ANOVA followed by post hoc Bonferroni tests (GTT and ITT) and represented means ± SEM. & and $P < 0.05, && and $$P < 0.01, and &&& and $$$P < 0.001, with & versus BHI-Recip and $ versus Lachnospiraceae-Recip.

