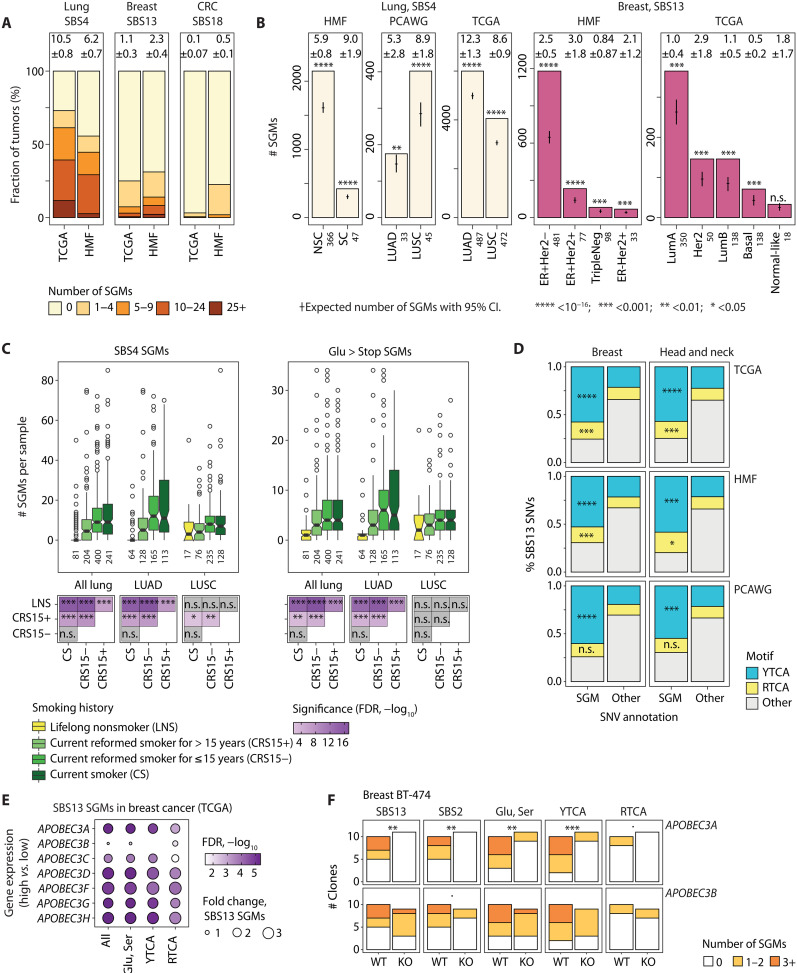
Fig. 4. Molecular and clinical associations of SGMs with tobacco smoking and APOBEC activity.
(A) Mutational burden of SGMs of SBS4, SBS13, and SBS18 in cancer genomes. Bar plots show SGM burden for these signatures in primary (TCGA) and metastatic cancers (HMF). Mean numbers of SGMs per cancer genome with ±95% CI are shown above the bars. (B) SBS4 and SBS13 SGMs are enriched in the molecular subtypes of lung and breast cancer. Expected total SGM counts with 95% CI are shown as points and whiskers. Sample sizes are shown on the x axis. Lung cancer subtypes include small cell (SC), non–small cell (NSC), adenocarcinoma (LUAD), and squamous cell carcinoma (LUSC). (C) SBS4 SGMs associate with the smoking history of patients with lung cancer in TCGA. Top: Box plots show the number of SBS4 SGMs (left) and Glu>Stop substitutions per cancer genome in patients grouped by smoking history (right), with sample sizes for each group shown in the x-axis labels. Bottom: Tile plot shows the statistical significance of the associations of smoking history and SGM burden (Wilcoxon rank sum test, FDR-adjusted). (D) SBS13 SGMs in breast and head and neck cancers are enriched in the DNA motif YTCA compared to other non-SGM SBS13 mutations (right). Fisher’s exact P values are shown. (E) APOBEC3 gene expression in breast cancer associates with more frequent SBS13 SGMs. TCGA breast cancer samples were compared using median dichotomization of each APOBEC3 gene (i.e., high versus low). FDR-adjusted P values of Wilcoxon rank sum tests are shown. (F) Breast cancer cell line clones with APOBEC3A knockout show a significantly reduced SBS13 SGM burden compared to APOBEC3A-WT clones, while no significant changes are seen in cells with APOBEC3B knockout. WGS data were retrieved from (43). P values were computed using negative binomial regression. n.s., not significant.

