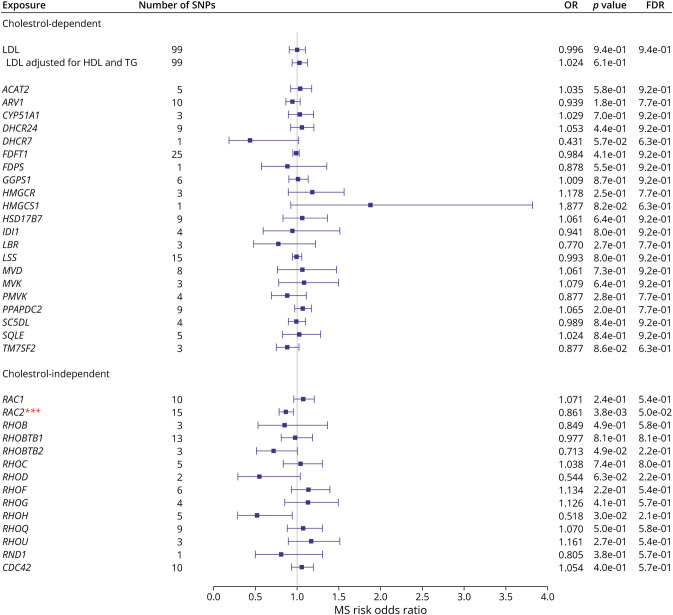
Figure 3. Forest Plot Showing the Associations Between the Genetically Mimicked Statins' Biological Effects Through Cholesterol-Dependent (Through LDL-C and Cholesterol Biosynthesis Pathway) and Cholesterol-Independent (Through Rho GTPases) and MS Risk.
Results from the Wald ratio (if the number of SNPs <2) or IVW are shown. Each point represents causal odds ratios of MS risk per one standard deviation increase in LDL-C level or gene expression in blood with a 95% confidence interval error bars. The gray vertical line (null line) indicates no effect. Abbreviations: LDL-C, low-density lipoprotein cholesterol; OR, odds ratio; FDR, false discovery rate; No. of SNPs, the number of genome-wide significant single-nucleotide polymorphisms.

