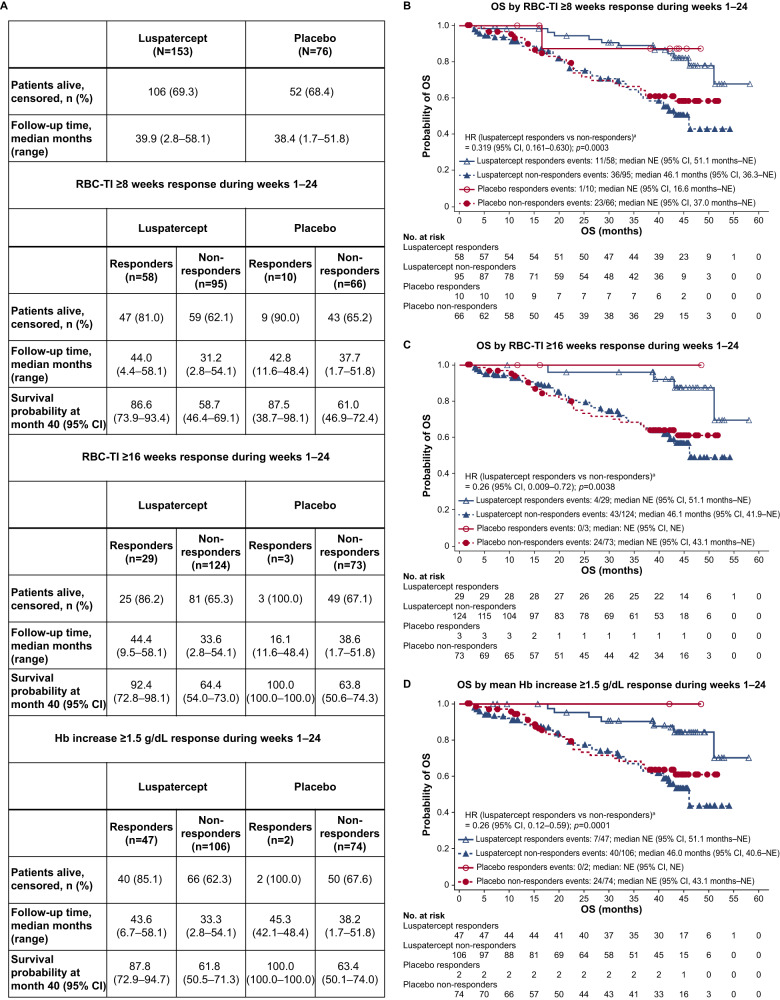
Fig. 2. OS by RBC-TI ≥8 weeks response, RBC-TI ≥16 weeks response, and mean Hb increase ≥1.5 g/dl response.
A Summary of OS. B OS by RBC-TI ≥8 weeks response during weeks 1–24. C OS by RBC-TI ≥16 weeks response during weeks 1–24. D OS by mean Hb increase ≥1.5 g/dL response during weeks 1–24. OS is calculated as the time from randomization date to death of any cause and is censored at the last date that the patient was known to be alive for patients who were alive at the time of analysis and for patients who discontinued from the study or were lost to follow-up. aUnstratified HR and log-rank test p value. CI confidence interval, Hb hemoglobin, HR hazard ratio, NA not applicable, NE not estimable, OS overall survival, RBC-TI red blood cell transfusion independence, SD standard deviation.

