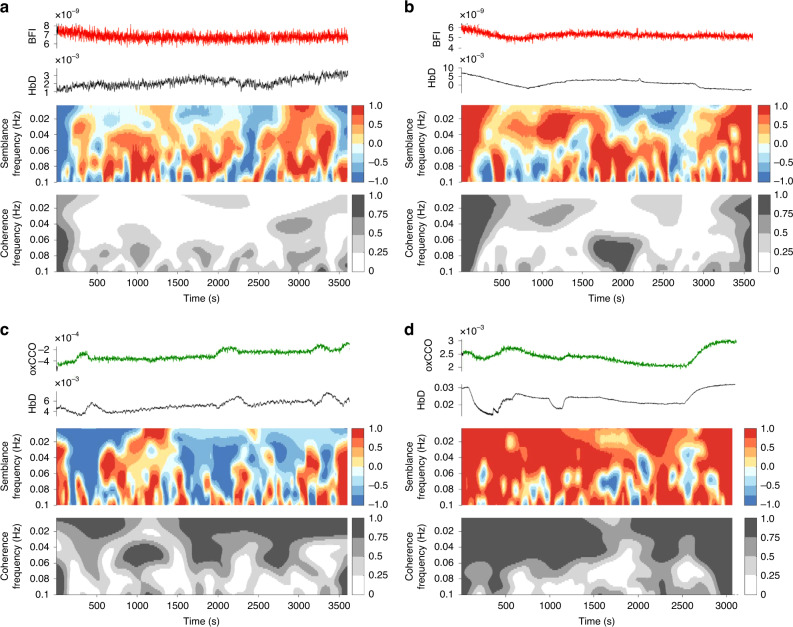
Fig. 3. Wavelet analysis of optical signals.
Individual examples of wavelet analysis calculations for cerebrovascular (a, b) and metabolic (c, d) dysfunction indices. For each example a–d, raw signals of compared parameters are shown (top), semblance analysis colour map with a colour legend –1–+1 (middle) and coherence analysis colour map with colour legend 0–1 (bottom). a Piglet in the control group with ‘good’ outcome, mean BFI-HbD semblance −0.08, coherence −0.05 and b piglet in severe insult group with ‘poor’ outcome, mean BFI-HbD semblance 0.16, coherence 0.21. c Piglet in the control group with ‘good’ outcome, mean oxCCO-HbD semblance 0.02, coherence 0.01 and d piglet in severe insult group and ‘poor‘ outcome, mean semblance 0.50, coherence 0.57.

