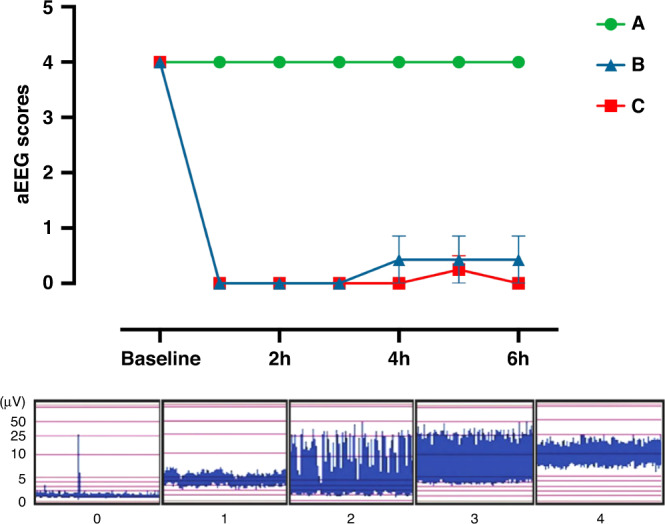
Fig. 4. aEEG activity during the study.

aEEG activity was classified according to Hellstrom-Westas et al.48 and scores averaged over every hour for three groups – group A (control), group B (moderate HI) and group C (severe HI). Data presented as the grouped least squared mean aEEG scores with standard error of the means (SEM). The least-square means were derived from a mixed-effect ANOVA model, with the Geisser–Greenhouse correction.
