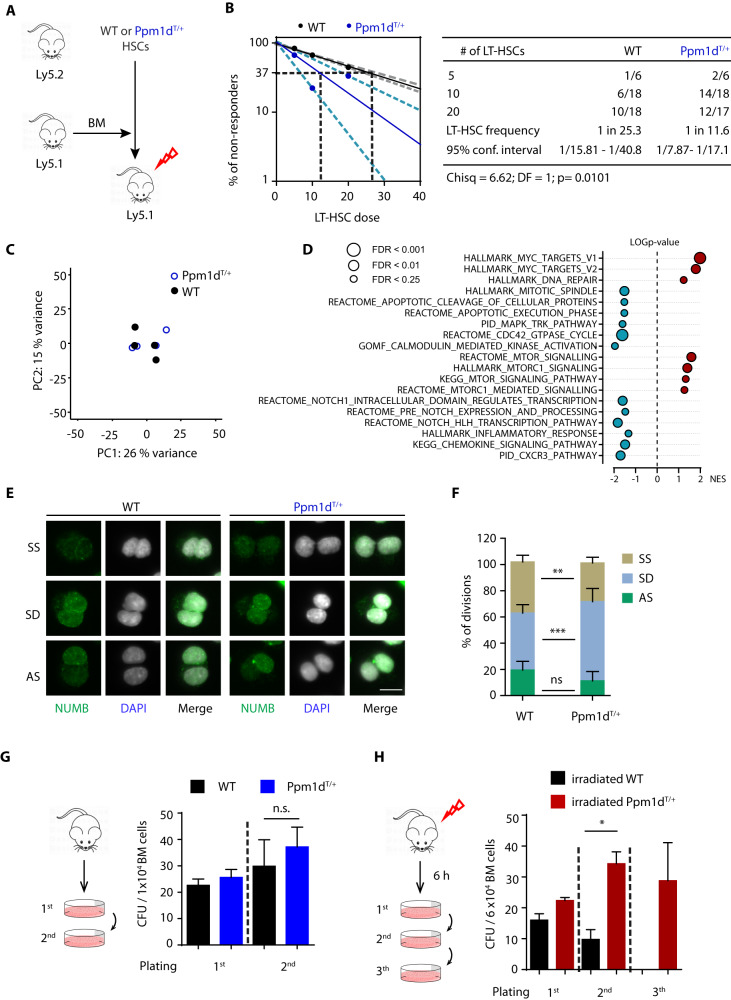
Fig. 2. Functional and transcriptomic analysis of Ppm1dT/+ HSCs.
A Transplantation scheme of 12-week-old WT and PPM1DT/+ HSCs. B The frequency of functional HSCs in WT (black) and Ppm1dT/+ (blue) mice was measured by limiting dilution competitive repopulation unit assays and calculated using ELDA online software based on Poisson distribution statistics (Chi-square test; Chisq = 6.62; p = 0.0101). The graph shows the curve fit of the log fraction of nonresponding mice (solid lines) and confidence intervals (dashed lines) versus the number of mice tested. Logarithmic plot; X-axis indicates the dose of transplanted cells and y-axis percentages of negative responders. Reconstitution was evaluated in blood of recipient mice 16 weeks after transplantation. A responder mouse was defined as engraftment ≥0.1% Ly5.2+ cells and contribution ≥0.5% in at least two out of three lineages (T, B, and myeloid cells). C Principal component analysis (PCA) of four WT (black symbols) and four Ppm1dT/+ HSC samples (blue symbols). D Gene Set Enrichment Analysis (GSEA) shows the top relevant pathways upregulated or downregulated in Ppm1dT/+ HSCs compared to WT HSCs. Data were generated using MSigBD Hallmark gene set v.7 (ranked according to NES values, FDR < 0.25). E Numb staining (green) in sorted WT and Ppm1dT/+ HSC after one division. DNA was counterstained with DAPI (white). Representative images of symmetric self-renewal (SS), symmetric differentiation (SD), and asymmetric (AS) division are shown. The scale bar represents 10 µm. F Quantification of the cell division types in WT and Ppm1dT/+ HSCs from E. Symmetric self-renewal (SS), symmetric differentiation (SD), and asymmetric (AS) division. Data represent mean ± s.d. Statistical significance was determined by 2-tailed Student’s t-tests (***p < 0.001, **p < 0.01, ns: not significant). At least 50 cells were counted per sample (n = 7 WT and n = 5 Ppm1dT/+ mice). G Schematic representation of the colony culture replating assays in WT and Ppm1dT/+ BM cells using MethoCult GF M3434. A total of 1 × 10⁴ BM cells were plated per well. Colonies were counted and replated on day 7. At least three mice were used per group in two separate experiments. Data represent mean ± s.d. Statistical significance was determined by 2-tailed Student’s t-tests (n.s. not significant). H Schematic representation of the colony culture replating assays. Mice were exposed to 3 Gy sub-lethal IR. Six hours (h) after exposure a total of 6 × 10⁴ BM cells was plated per well. Colonies were counted and replated on day 7. At least three mice were used per group in two separate experiments. Data represent mean ± s.d. Statistical significance determined by 2-tailed Student’s t-tests (*p < 0.05).

