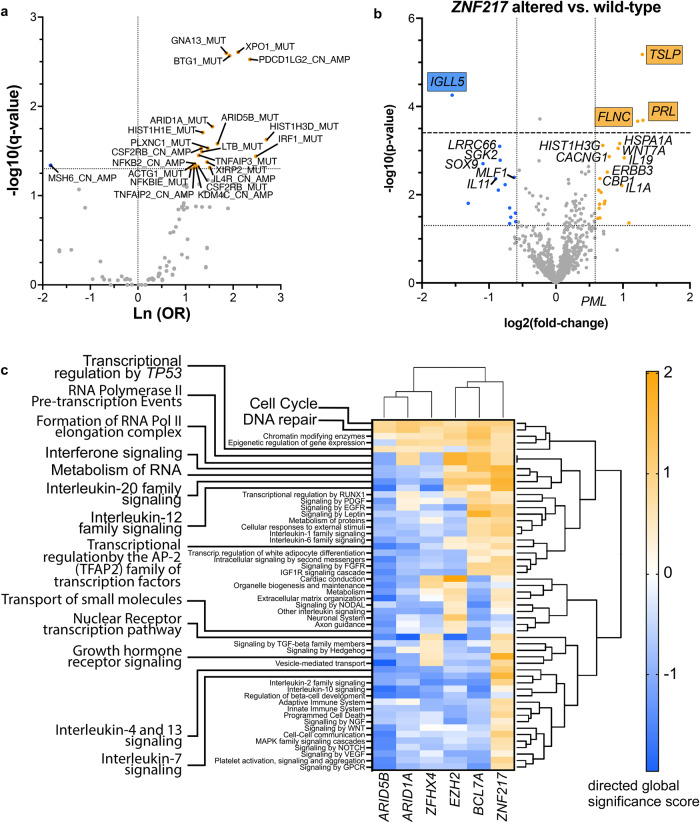
Fig. 2. Gene expression in ZNF217 altered PMBCL.
a Volcano plot showing systematic evaluation of pairwise associations between mutated ZNF217 and mutations or copy-number alterations in other genes of the targeted panel. 2 × 2 contingency tables were generated for each pair followed by Fisher’s exact tests and adjustment for multiple testing using Benjamini-Hochberg correction. y-axis displays the q-value of each pair as -log10(q) (dotted line indicates q < 0.05). x-axis represents the strength of the correlation expressed as log odds where blue dots indicate mutually exclusive and orange dots co-mutated genomic lesions. b RNA was isolated from n = 120 PMBCL patients and analyzed with the human nCounter PanCancer Pathways panel probe set (Nanostring). Volcano plot shows differentially higher (orange) and lower (blue) expressed transcripts with their log2-fold change on the x-axis. Y-axis shows -log10(p) (dotted line indicates p < 0.05; dashed line indicates FDR < 0.05). c Differential expression at gene set level. Global directed gene expression heatmap on gene set level, bearing either ≥1 copy-number changes and/or ≥1 SNV in either ARID5B, ARID1A, ZFHX4, EZH2, BCL7A, or ZNF217 versus respective wild types demonstrated substantial differences in the global perturbation patterns induced by ZNF217 alterations. Gene expression was analyzed by use of an extended nCounter PanCancer probe panel (Nanostring technologies). Directed global significance score was calculated using the Nanostring nSolver 4.0.70 software as the square root of the mean signed squared t-statistic for the genes in a gene set, with t-statistics coming from the linear regression underlying the differential expression analysis. Pathways with the highest and smallest differences in pathway scores between ZNF217 and ARID1A were highlighted.

