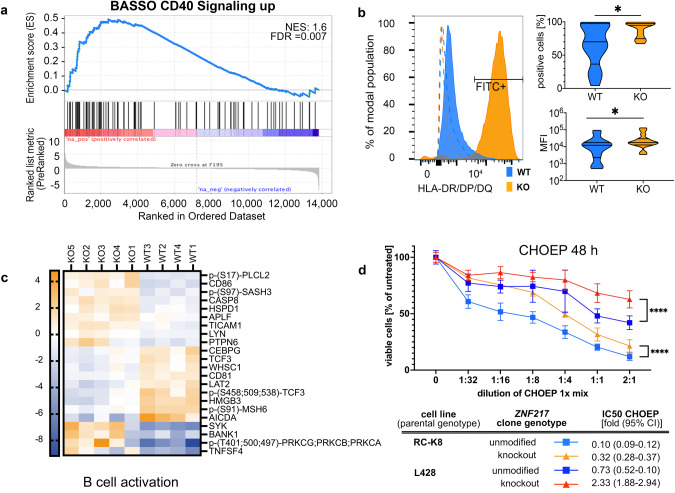
Fig. 4. B cell activation signature after knockout of ZNF217.
a Pre-ranked gene set enrichment analysis (GSEA) was performed based on a gene signature derived from CD40 activation [60]. Graph shows normalized enrichment scores (NES) and false discovery rate (FDR) q-values of GSEA analysis b Flow cytometry analysis of MHC class II presentation of ZNF217KO (n = 15) and ZNF217WT (n = 13; data obtained from n = 3 independent experiments). Left side: representative histogram of fluorescence shift comparing one anti-HLA-DR/DP/DQ-FITC-stained WT with one randomly assigned KO sample. Dashed lines: isotype controls. Right side: quantification of positive cells over threshold (top) and mean fluorescence intensity (bottom). Mann–Whitney test; *<0.05. c Significantly differentially abundant (phospho-)proteins (FDR < 0.05) associated with B cell activation visualized by Euclidean clustering of z-scores (Supplementary Table S8.4 and S8.5). d Treatment of cell clones with R-CHOEP resulted in a lower IC50 in ZNF217WT versus ZNF217KO cells of 3.2 to 3.4 -fold. Figure shows merged data from n = 11 different ZNF217KO or ZNF217WT clones obtained from n = 3 independent WST-1 assay experiments after 48 h of increasing dilutions of R-CHOEP treatment (mean with 95% CI; Mixed effect model with Geisser–Greenhouse correction). 1x R-CHOEP is defined in Supplementary Table S4. q indicated by *<0.05; **<0.01, ***<0.001, ****<0.0001.

