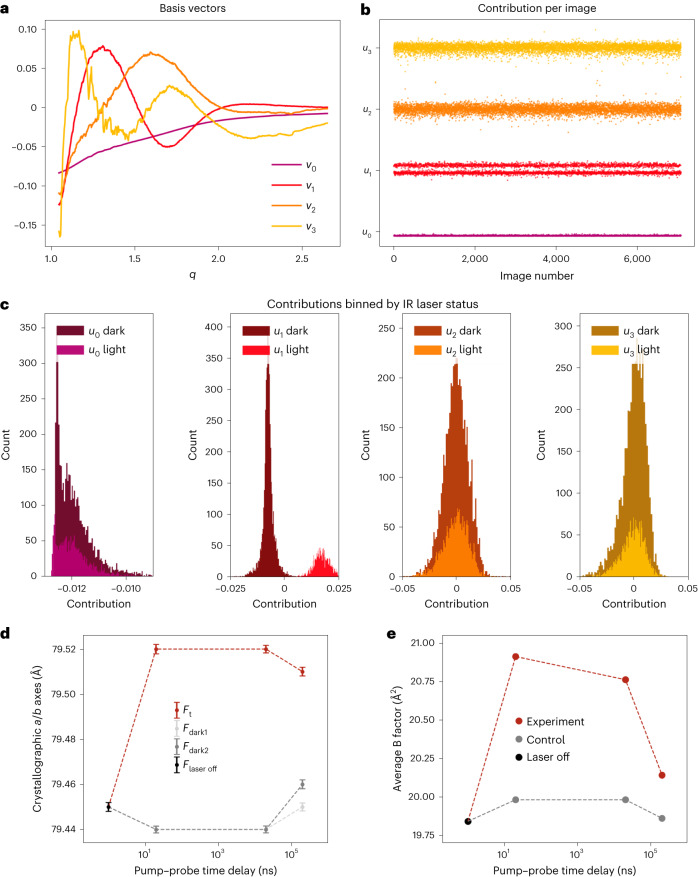
Fig. 2. Experimental detection of T-jump.
a,b, Radial averages of diffraction images from the 20 ns dataset were decomposed using SVD. The basis vectors (vn) associated with the largest four singular values were visualized (a), as was the contribution (un) of each corresponding basis vector to each radial average (b). c, U1 values were split, which was clarified by plotting the values as histograms. The values and sign of u1n associated with the second largest singular value, correlate with IR laser status, as reported by the IR laser diode. d, Analysis of the crystallographic a/b axis lengths, equivalent under P43212 symmetry, as a function of pump–probe time delay reveal thermal expansion of the unit cell. All values in d are mean ± 95% confidence interval. Time zero corresponds to the laser-off (laser off; n = 9,464) dataset, with laser-on (light; 20 ns, n = 15,253; 20 µs, n = 13,681; 200 µs, n = 11,931) and interleaved laser-off (dark1; 20 ns, n = 14,383; 20 µs, n = 13,559; 200 µs, n = 11,857 and dark2; 20 ns, n = 14,454; 20 µs, n = 13,893; 200 µs, n = 11,950) datasets plotted for each pump–probe time delay. Unit cell dimensions expand following perturbation with an IR laser, while unilluminated data show consistent unit cell dimensions over the course of the experiment. e, Similarly, the average B-factor of refined models increases following perturbation with an IR laser. Models were refined against laser off, experiment or control structure factors.

