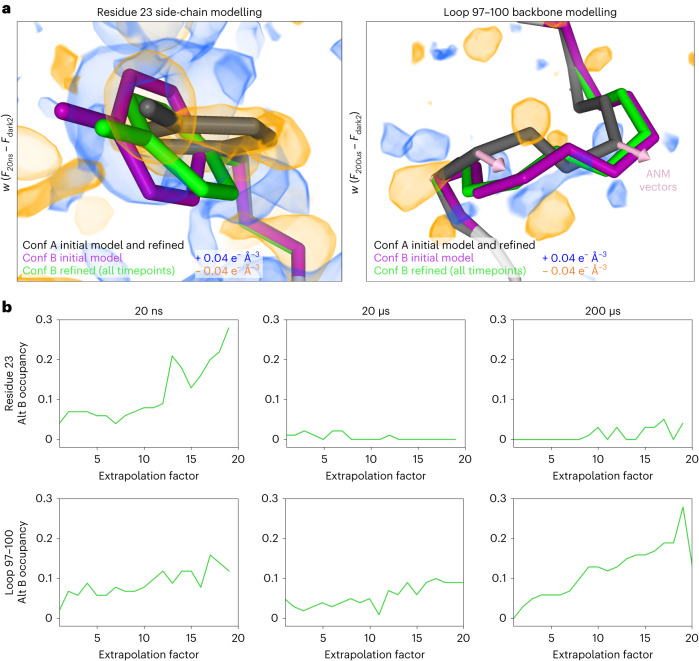
Fig. 4. Explicit modelling of time-resolved structural changes.
a, For all pump–probe time delays, difference electron density maps were visualized at an absolute contour level of ±0.04 e− Å−3 alongside the refined models. Alternate conformations were manually modelled into the experimental difference density for several regions, including residues 23 and 97–100, then refined against ESFMs. An ANM was developed on the basis of the ground state (conformation A of the initial model) and vectors were visualized for comparison with alternate conformers. b, Occupancies of the alternative conformations were examined as a function of increasing extrapolation factors. The stability of the hypothetical high-energy states during the coordinate refinement, and the increase in their occupancies with increasing extrapolation factor provide evidence that these conformations are populated in the ensemble.

