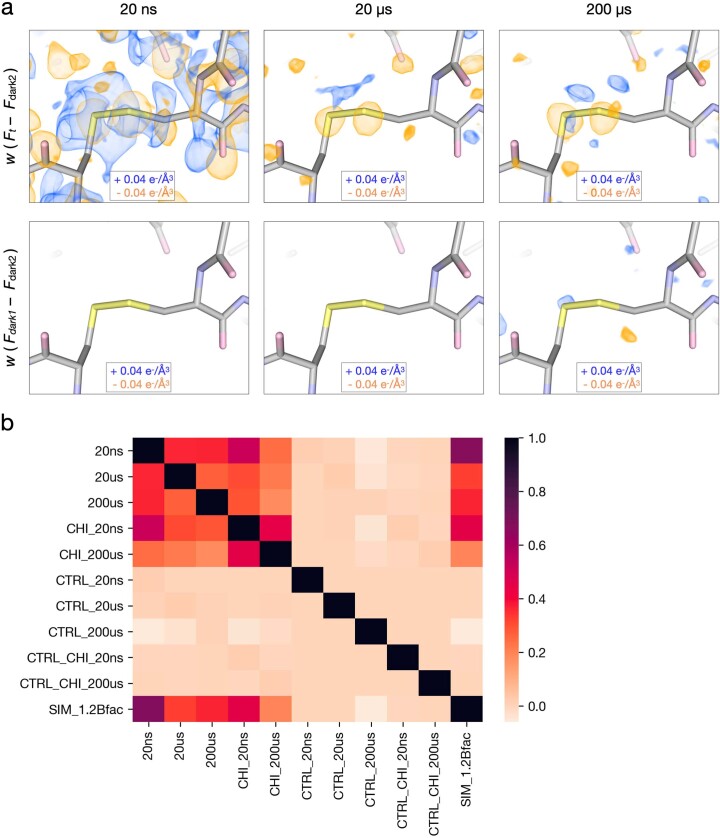
Extended Data Fig. 1. Qualitative and quantitative assessment of time-resolved difference electron density features.
(a) Comparison of weighted difference density maps for each pump-probe time delay (Flight – Fdark2) and matched controls (Fdark1 – Fdark2) visualized at an absolute contour level of ± 0.04 e−/Å3 alongside initial refined models. Atoms with greater electron density, such as the disulfide bridge between residues 76 and 94, display clear signals across all experimental maps yet very little noise in matching controls. (b) Pairwise correlation coefficients were calculated between all difference maps, revealing varying levels of similarity between experimental maps and low noise across controls. Labels correspond to time-delay (20ns, 20µs, 200µs) presence of the inhibitor, chitobiose (CHI), whether a map was a matched control (CTRL), or based on simulated (SIM) structure factors (see Methods for details).

