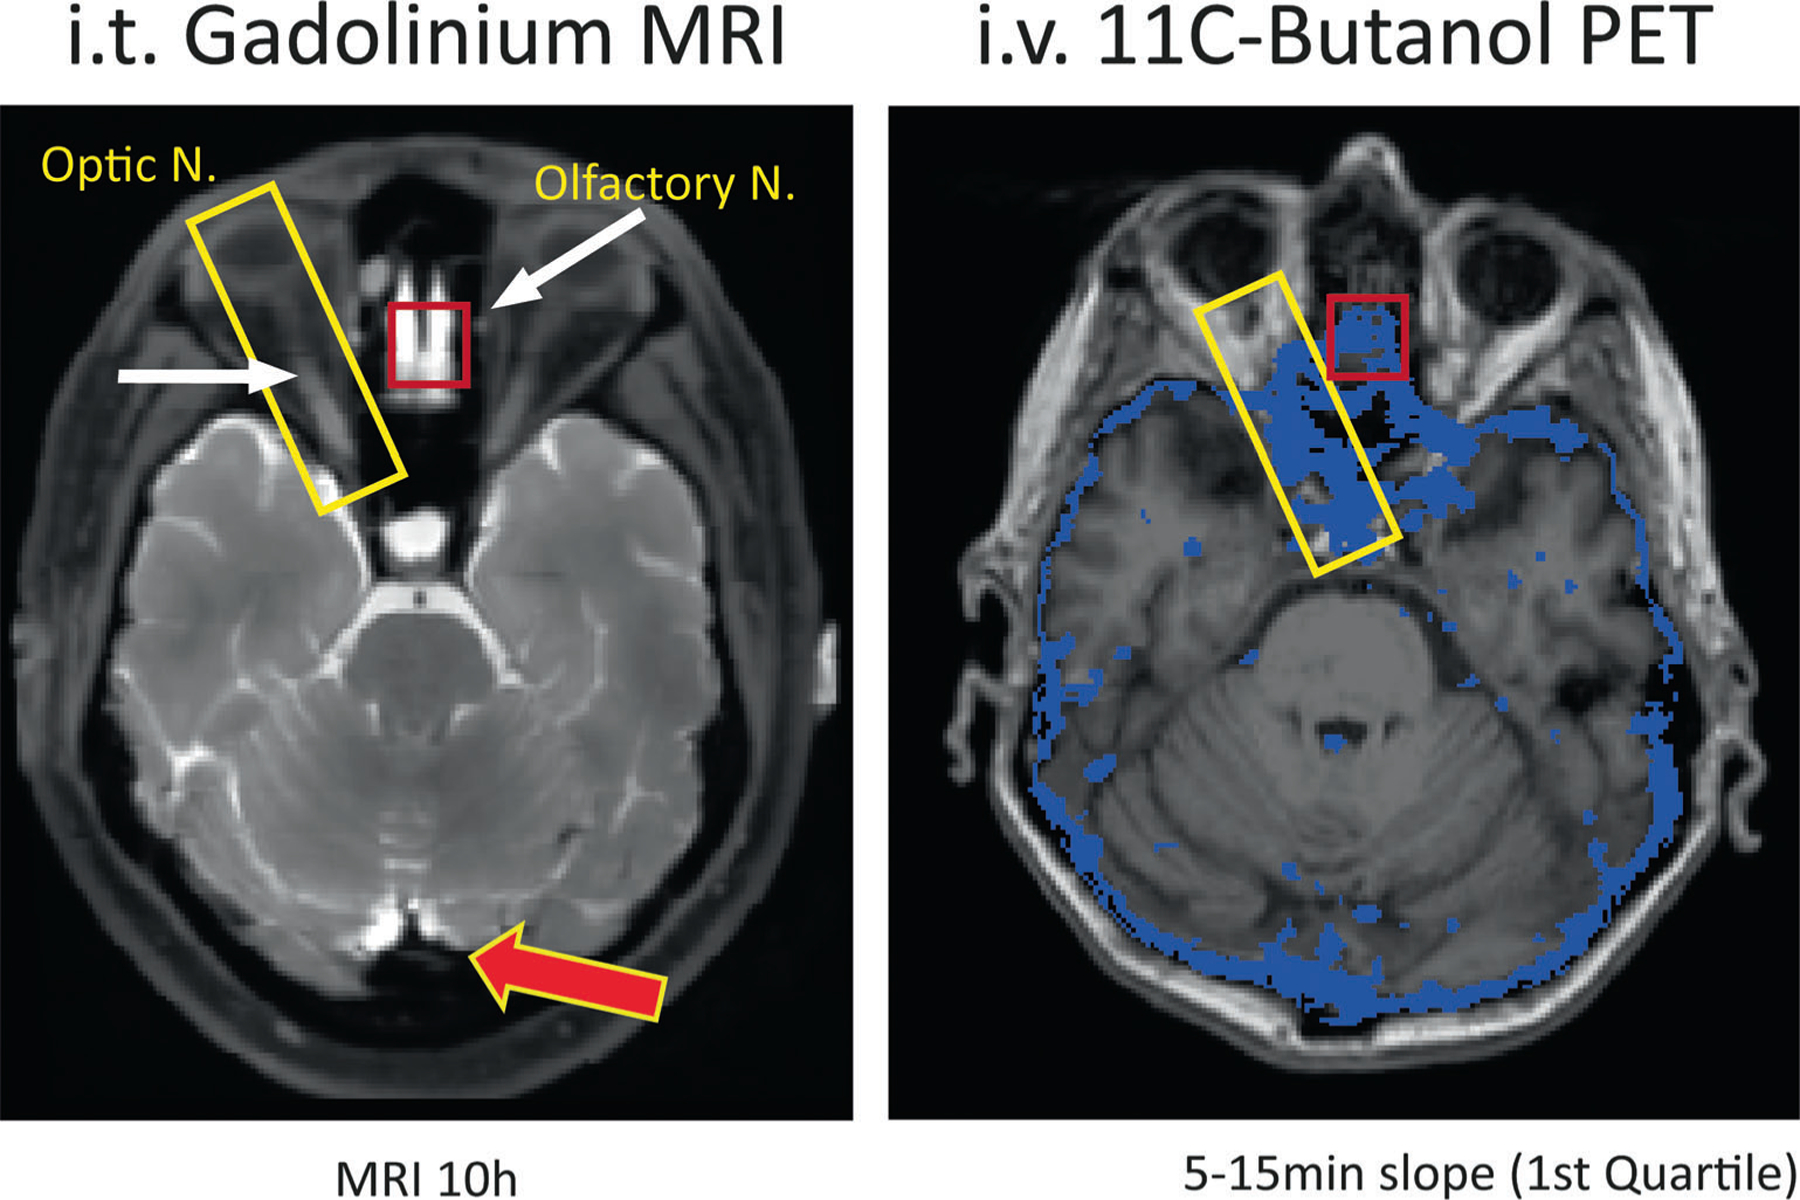
FIGURE 11:

The figure demonstrates the anatomical correspondence between CSF pathways identified with the MRI contrast agent Gadolinium (left) and with the 11C-Butanol PET tracer (right). Several enhanced areas as identified by MRI and PET are highlighted in the figure, including the optic nerve and the cribriform plate at the skull base where the olfactory nerves pass. The MR image on the left was acquired 10 hours after intrathecal (lumbar) injection of 0.5 mL Magnevist (Gd-DTPA) on a 3 T GE MR750 and is a fat suppressed T1 image with a mm isotropic resolution, repetition ms, echo msec, and 25.6 cm field of view. The MR-PET image on the right is derived from the IV administration of 11C-Butanol imaged dynamically (list mode) for 60 minutes with a PET SIEMENS Biograph 64, and coregistered with T1-weighted MPRAGE data from a 3 T SIEMENS Prisma. For the entire brain, the voxel-wise distribution of butanol slopes derived between 5 and 15 minutes after injection was computed. The blue area in the right image identifies the “slowest quartile” of clearing voxels superimposed on the corresponding axial MR image. The MRI image is courtesy of Drs. Jonathan Dyke Weill Cornell Medicine and Joseph Levi Chazen Hospital for Special Surgery New York.
