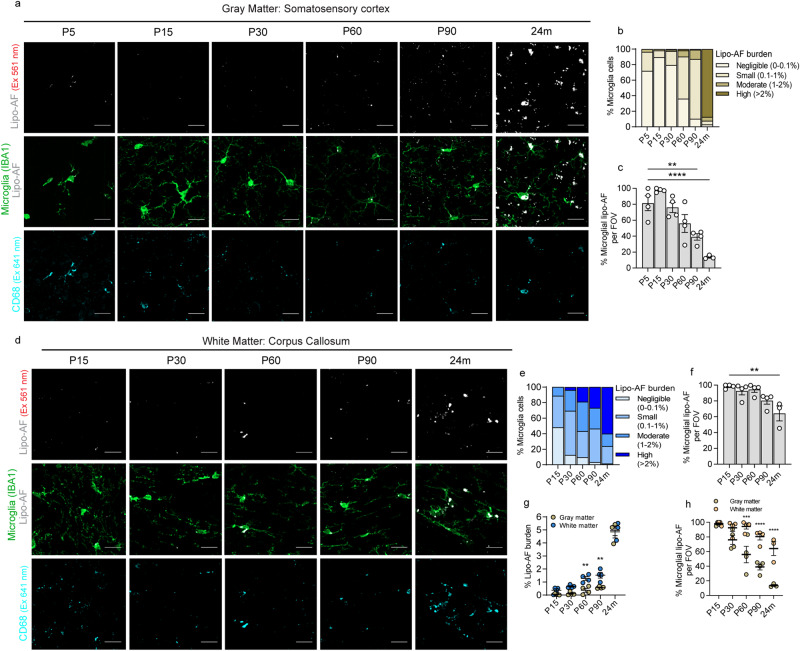
Fig. 2. Lipo-AF accumulation in microglia in the gray and white matter.
Representative images of anti-IBA1+ microglia, lipo-AF (excitation (Ex) 561 nm) and anti-CD68+ lysosomes in the developing (P5, P15, P30), young adult (P60, P90), and aged (24 months) gray matter (a, cortex) or white matter (d, corpus callosum). Scale bars = 10 μm. Quantification of the percentage of cortical microglial with negligible (0–0.1%), small (0.1–1%), moderate (1–2%) and high (>2%) percentages of their total volume occupied by lipo-AF in the gray (b) or white (e) matter. Quantification of the percentage of lipo-AF per field of view (FOV) inside microglia in the gray (c) and white (f) matter. c One-way ANOVA with Dunnett’s multiple comparisons test (F = 17.46, df = 22; P5 vs P90 p = 0.0020, P5 vs 24 m p < 0.0001). f One-way ANOVA with Dunnett’s multiple comparisons test (F = 7.225, df = 18; P15 vs 24 m p = 0.0012). g Quantification of the average percentage of microglial volume occupied by lipo-AF in gray and white matter. Two-way ANOVA with Šidák’s multiple comparisons test (Interaction: F = 1.877, df = 4; Row Factor: F = 190.5, df = 4; Column Factor: F = 23.81, df = 1; P60 p = 0.0058, P90 p = 0.0040). h Quantification of the average percentage of lipo-AF per field of view inside of microglia in gray and white matter microglia. Two-way ANOVA with Šidák’s multiple comparisons test (Interaction: F = 6.267, df = 4; Row Factor: F = 29.18, df = 4; Column Factor: F = 66.24, df = 1; P60 p = 0.0002, P90 & 24 m p < 0.0001); *p < 0.05 **p < 0.01 ***p < 0.001 ****p < 0.0001. All data are represented as mean ± SEM, n = 3–4 mice per experiment, 2 M, 2 F for each timepoint between P5-P90. 2 M, 1 F for 24 m. Source data are provided as a Source Data file.

