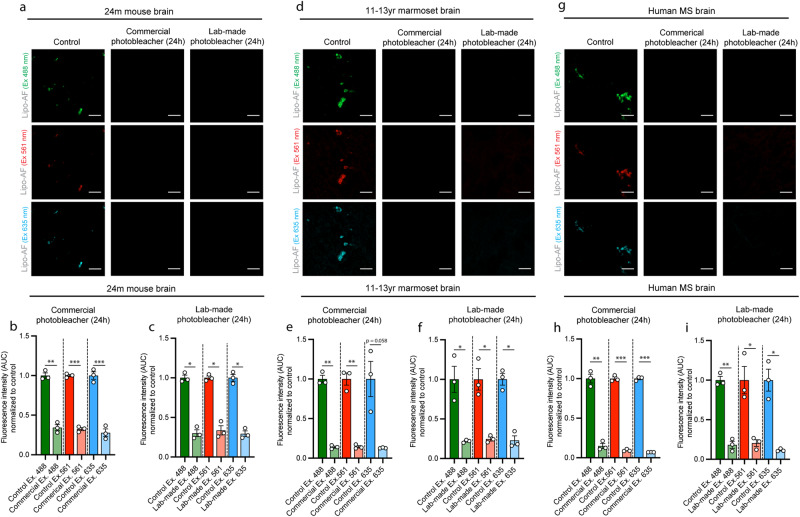
Fig. 6. A lab-made photobleacher to quench lipo-AF signal.
Representative images of lipo-AF excited (Ex.) with differ laser lines in untreated or photobleached samples in the aged mouse (a), marmoset (d), and human multiple sclerosis (MS) (g) cortices. Scale bars = 10 μm. b–i Quantification of lipo-AF puncta fluorescence intensity area under the curve (AUC) in aged mouse (b, c), marmoset (e, f), and human (h, i) cortices without (control, dark bars) or with photobleaching (pale bars) for the are data using the commercial (b, e, h) and lab-made (c, f, i) photobleachers. All data presented as mean ± SEM normalized to control, n = 3 mice, 3 marmoset, or 3 human samples. Paired two-tailed T tests between laser lines. Ex. 488, t = 11.96, df = 2, p = 0.0069; (b) Ex. 561, t = 49.61, df = 2, p = 0.0004; (b) Ex. 635, t = 75.28, df = 2, p = 0.0002; (c) Ex. 488, t = 9.497, df = 2, p = 0.0109; (c) Ex. 561, t = 9.372, df = 2, p = 0.0112; (c) Ex. 635, t = 9.053, df = 2, p = 0.0120. e Ex. 488, t = 24.12, df = 2, p = 0.0017; (e) Ex. 561, t = 12.81, df = 2, p = 0.0060; (e) Ex. 635, t = 3.964, df = 2, p = 0.0581; (f) Ex. 488, t = 4.468, df = 2, p = 0.0466; (f) Ex. 561, t = 5.652, df = 2, p = 0.0299; (f) Ex. 635, t = 5.927, df = 2, p = 0.0273. h Ex. 488, t = 28.95, df = 2, p = 0.00012; (h) Ex. 561, t = 69.05, df = 2, p = 0.0002; (h) Ex. 635, t = 65.18, df = 2, p = 0.0002; (i) Ex. 488, t = 13.77, df = 2, p = 0.0052; (i) Ex. 561, t = 5.739, df = 2, p = 0.0290; (i) Ex. 635, t = 6.002, df = 2, p = 0.0267. *p < 0.05 **p < 0.01, ***p < 0.001. (mouse = 2 M, 1 F; marmoset= 2 M, 1 F; human = 3 F). Source data are provided as a Source Data file.

