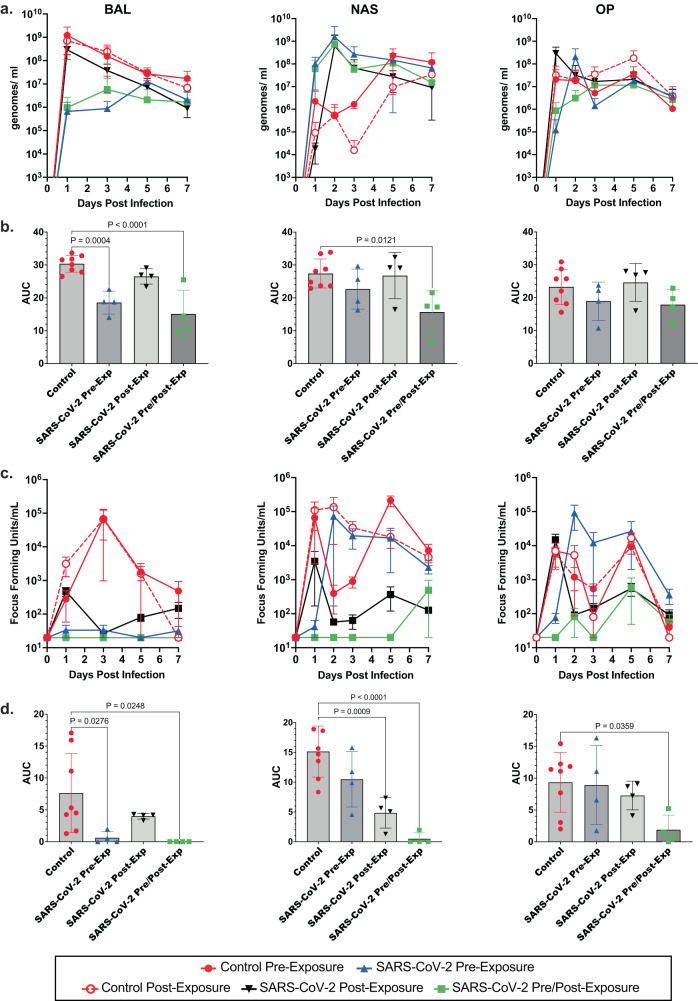
Fig. 2. Inhaled aerosolized anti-SARS-CoV-2 mAb treatment reduces SARS-CoV-2 in respiratory tract.
a SARS-CoV-2 viral RNA was quantified in BAL, NAS, and OP samples by qRT-PCR using a standard curve. Mean values ±Standard deviation (SD) for each cohort at each day post infection are shown. b Area under the curve (AUC) based on viral RNA levels was for determined each animal. Controls were considered as single cohort for this analysis. Individual values (symbols), mean AUC (bars), and SD (error bars) are shown. Statistical significance was determined by Tukey one-way ANOVA, comparing each group to controls. c Infectious virus in BAL, NAS, and OP was quantified by focus-forming assay. Mean values ± SD for each cohort at each day post infection are shown. d AUC (mean values ± SD) based on infectious titers was determined as above, and statistical significance was determined by Tukey one-way ANOVA. N = 4 biologically independent animals per group. Colors and symbols are: solid red circle, Control Pre-Exp group; solid blue triangle, SARS-CoV-2 Pre-Exp group; open red circle, Control Post-Exp group; solid black triangle, SARS-CoV-2 Post-Exp group; and solid green square, SARS-CoV-2 Pre/Post-Exp group. Exact P values are shown where greater than P = 0.05. Source data are provided as a Source Data file.

