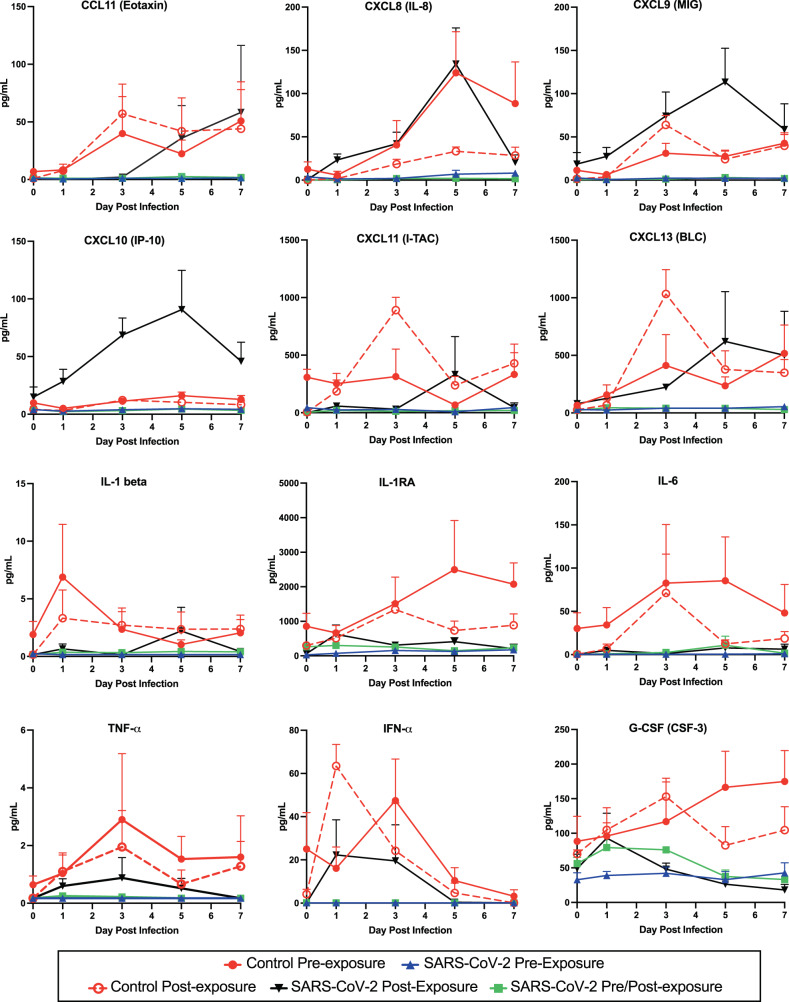
Fig. 5. Pulmonary immune activation following SARS-CoV-2 infection is blocked by inhaled aerosolized anti-SARS-CoV-2 mAb treatment.
Kinetic analysis of chemokine and cytokine production was quantified for clarified BAL samples using Luminex bead-based assays. Each graph represents data for one chemokine or cytokine, as labeled at the top of the graph. A protein standard curve was generated from a 7-point dilution series and used to calculate concentration. Individual data points for each animal (n = 4 individual animals per group) within each group are shown as the mean and SEM for each group at each timepoint. Colors in the graphs are: solid red circle, Control Pre-Exp group; solid blue triangle, SARS-CoV-2 Pre-Exp group; open red circle, Control Post-Exp group; black triangle, SARS-CoV-2 Post-Exp group; and solid green square, SARS-CoV-2 Pre/Post-Exp group. Source data are provided as a Source Data file.

