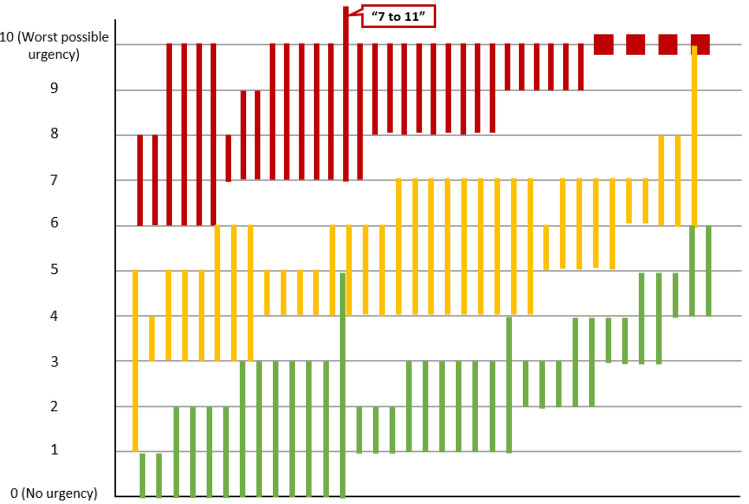
Fig. 1.
Distribution of Bowel Urgency NRS Severity Level Categories by Individual Participant. Each participant was asked to provide a score range for the 3 levels of severity (ie; mild, moderate, severe); therefore, each participant is represented by 3 bars. Green = “mild” ranges; Yellow = “moderate” ranges; Red = “Severe ranges.” Four participants indicated that “Severe” was “a 10” rather than providing a range; these participants are represented by the red squares

