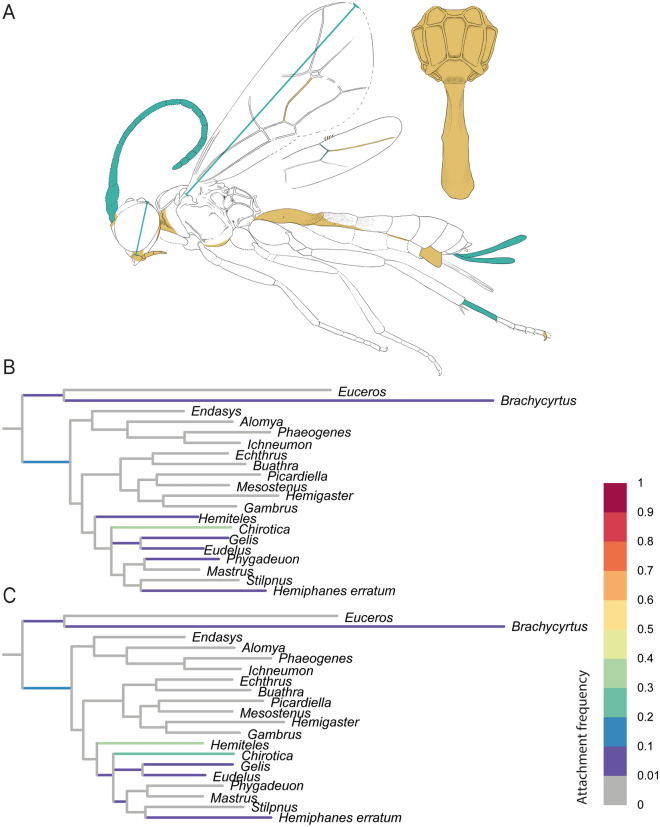
Fig. 5.
RoguePlot placement of Phygadeuontinae fossil Magnocula sarcophaga gen. et sp. nov. before and after micro-CT scanning. The plots include all branches from the majority-rule consensus tree where the attachment probability was higher than 1%. A Magnocula sarcophaga gen. et sp. nov. with colours indicating newly revealed body characteristics. Blue colouration represents newly added measurements; orange highlights either newly coded characters or characters where states could be reduced after the CT scan. B Placement before CT scanning. C Placement after CT scanning

