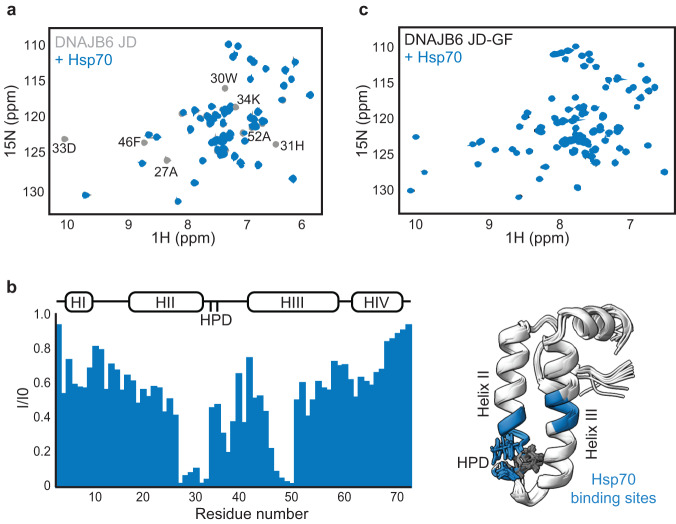
Fig. 2. Regulatory region in DNAJB6 GF blocks Hsp70 binding.
a 15N–1H HSQC spectra of 0.2 mM DNAB6JD alone (light gray), and in complex with 0.1 mM 2H Hsp70 chaperone (blue). Peaks missing from the colored spectrum indicate proximity to Hsp70 (binding). b (left) Residue-resolved NMR signal intensity ratios I/I0, where I and I0 are signal intensities for Hsp70-bound and free DNAJB6JD, respectively. The positions of the four helices in each J-domain are indicated at the top of the plot. Large changes in intensity are detected at the end of helix II, the flexible loop containing the conserved HPD motif, and at helix III, corresponding to Hsp70-binding sites. b (right) Cartoon representation of the 10 lowest energy solution-NMR structures calculated by CS-ROSETTA, with the Hsp70-binding region, identified by NMR colored blue. c 15N–1H HSQC spectra of 0.2 mM DNAJB6JD-GF alone (black), and in the presence of 0.4 mM 1H Hsp70 (blue). No changes were observed in the spectrum of DNAJB6JD-GF upon the addition of Hsp70, indicating a lack of interaction.

