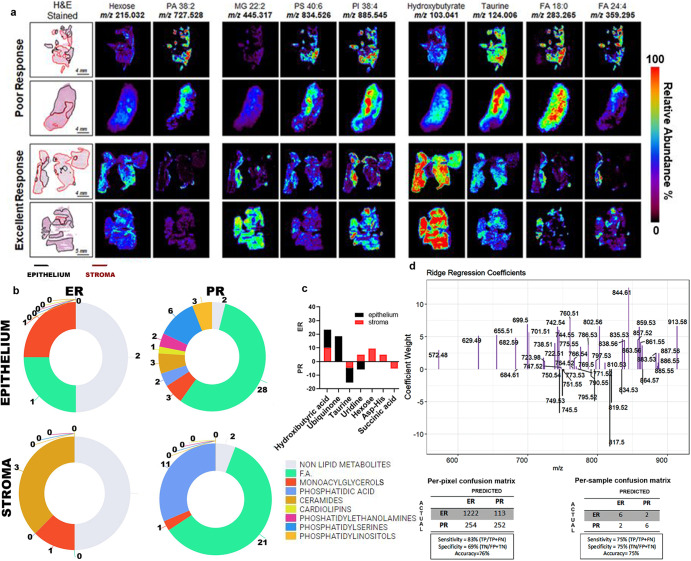
Fig. 2. Analysis of high-grade serous ovarian cancer (HGSC) samples obtained prior to neoadjuvant chemotherapy (NACT) based on excellent (ER) or poor (PR) response.
a DESI-MS imaging of tumor tissue sections obtained from 52 patients (30 ER and 22 PR) was performed. Negative ion mode DESI-MS ion images of two ER and two PR tumors showing the spatial distribution and relative abundances of nine metabolites and lipid species for each sample are represented. Within each column, the ion images were normalized to the same ion intensity (100% relative abundance, red) for ease of comparison among individual samples and response groups. Optical images of the H&E-stained tissue sections are shown for each sample, with regions of tumor epithelium outlined in black and regions of stroma outlined in red. b Distribution of lipid classes representing higher relative abundances in the stroma and epithelium of ER and PR pre-chemotherapy tissues, from DESI-MS. c Histograms representing relative abundances of small metabolites in the epithelium and stroma of ER and PR tumors. d Plots of ridge regression coefficients for the predictive model. The analysis was restricted to the primary tumor sites (adnexa and ovaries, N = 16), and samples from metastatic sites (omentum or abdominal organs) were excluded (N = 36). A ridge regression model was used to estimate the probability of every mass spectrum belonging to either the ER or PR group. ER excellent responders, PR poor responders.

