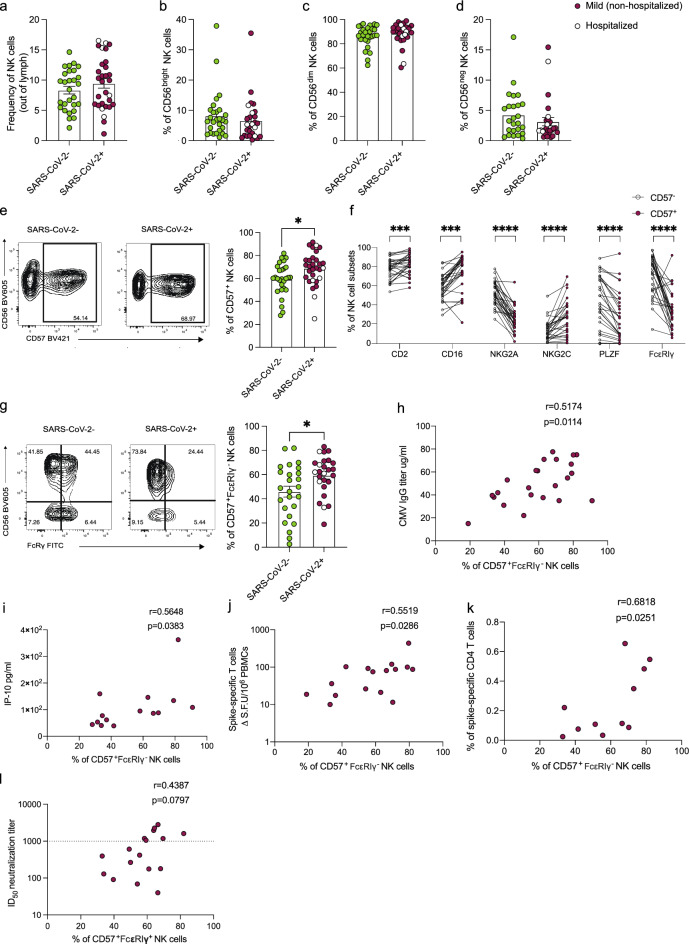
Figure 1.
Phenotypic assessment of NK cells in convalescent SARS-CoV-2 infection in PLWH. Summary analysis of the frequency of (a) total NK cells out of lymphocytes, (b) CD56bright, (c) CD56dim, and (d) CD56neg NK cells in SARS-CoV-2 negative (n = 28, green) and SARS-CoV-2-positive (n = 30, red) PLWH. Filled red dots: mild (non-hospitalized cases); Open circle: hospitalized cases. (e) Representative flow cytometric plots and summary analysis of the percentage of CD57+ NK cells in SARS-CoV-2-positive and -negative PLWH. (f) Paired analysis showing the expression of CD2, CD16, NKG2A, NKG2C, PLZF, and FcεRIγ markers within CD57+ (red) and CD57− (white) NK cells in SARS-CoV-2-positive PLWH. (g) Representative plots and summary analysis of the percentage of FcεRIγ+CD57+ NK cells in the study groups. Correlation analysis between the frequency of FcεRIγ+CD57+ NK cells and (h) HCMV IgG titers and (i) plasma level of IP-10 in SARS-CoV-2-positive PLWH. Correlation analysis between the frequency of FcεRIγ+CD57+ NK cells and (j) magnitude of Spike-specific T cell responses measured by IFN-γ-ELISpot and (k) percentage of Spike-specific CD4+ T cells in SARS-CoV-2-positive PLWH. (l) Correlation between frequencies of FcεRIγ+CD57+ NK cells in SARS-CoV-2-positive PLWH and neutralization titers (ID50) against SARS-CoV-2 pseudovirus. Data are represented as geometric mean ± SEM [(a), (b), (c), (d), (e), (g), (l)]. Significance determined by two-tailed Mann–Whitney U test [(a), (b), (c), (d), (e), (g), (l)] or Wilcoxon-signed rank test [(f)]; *p < 0.05, **p < 0.01, ***p < 0.001, ****p < 0.0001. Non-parametric Spearman test (two-tailed) was used for correlation analysis (unadjusted p value displayed) [Adjusted p values after Benjamini-Hochberg (h, p = 0.0214), (i, p = 0.0478), (j, p = 0.0429), (k, p = 0.0418)]. See also Supplementary Fig. 1.

