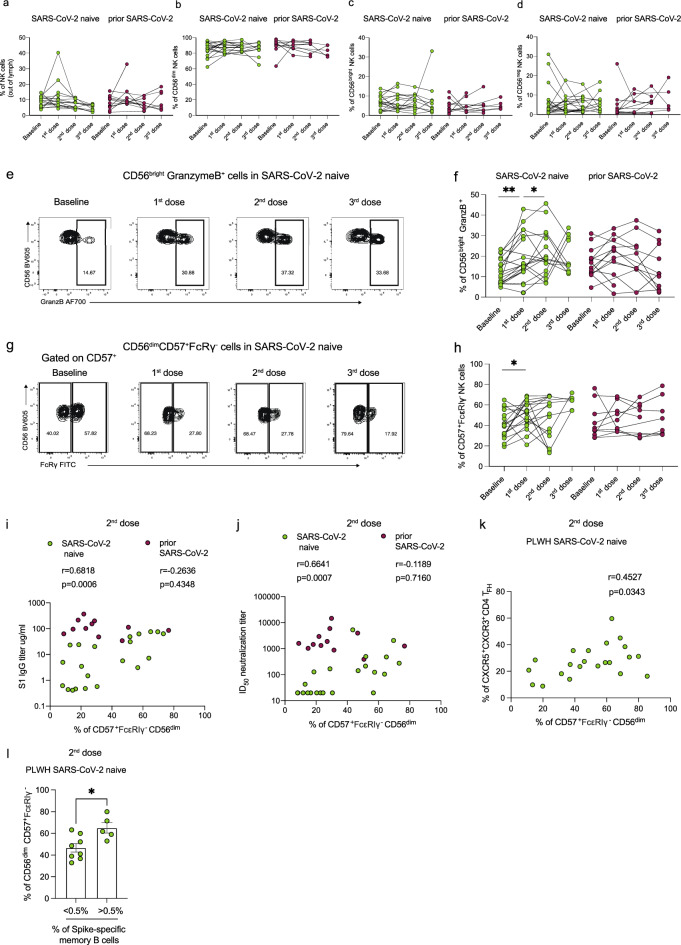
Figure 2.
Longitudinal assessment of adaptive NK cells following SARS-CoV-2 vaccination in PLWH. Longitudinal analysis of the frequencies of (a) total NK cells, (b) CD56bright, (c) CD56dim, and (d) CD56neg NK cells in PLWH with or without prior SARS-CoV-2 infection at baseline (pre-vaccine) and following first, second, and third dose of vaccine. (e) Representative flow cytometric plots and (f) summary analysis of the percentage of GranzB+CD56bright NK cells. (g) Representative flow plots and (h) summary analysis of the percentage FcεRIγ+CD57+ CD56dim NK cells. Correlation analysis between the frequency of FcεRIγ+CD57+ NK cells and (i) S1 IgG titers or (j) neutralizing titers (ID50) after two doses of vaccine in PLWH with or without prior SARS-CoV-2 infection. (k) Correlation analysis between percentage of FcεRIγ+CD57+ NK cells and CXCR3+CXCR5+TFH cells after two doses of vaccine in SARS-CoV-2 naïve PLWH. (l) Comparison of the percentage of FcεRIγ+CD57+ NK cells in SARS-CoV-2 naïve PLWH according to their levels of Spike-specific memory B cells. The threshold was set to 0.5%. Significance determined by two-tailed Wilcoxon-signed rank test [(a), (b), (c), (d), (f), (h)], or two-tailed Mann–Whitney U test [(i)]; *p < 0.05, **p < 0.01. Non-parametric Spearman test (two-tailed) was used for correlation analysis (unadjusted p value displayed) [Adjusted p values after Benjamini-Hochberg (i, SARS-CoV-2 naïve p = 0.0012), (j, SARS-CoV-2 naïve p = 0.0014), (k, SARS-CoV-2 naïve p = 0.0686)] Data are represented as geometric mean ± SEM [(i)]. See also Supplementary Fig. 2.

