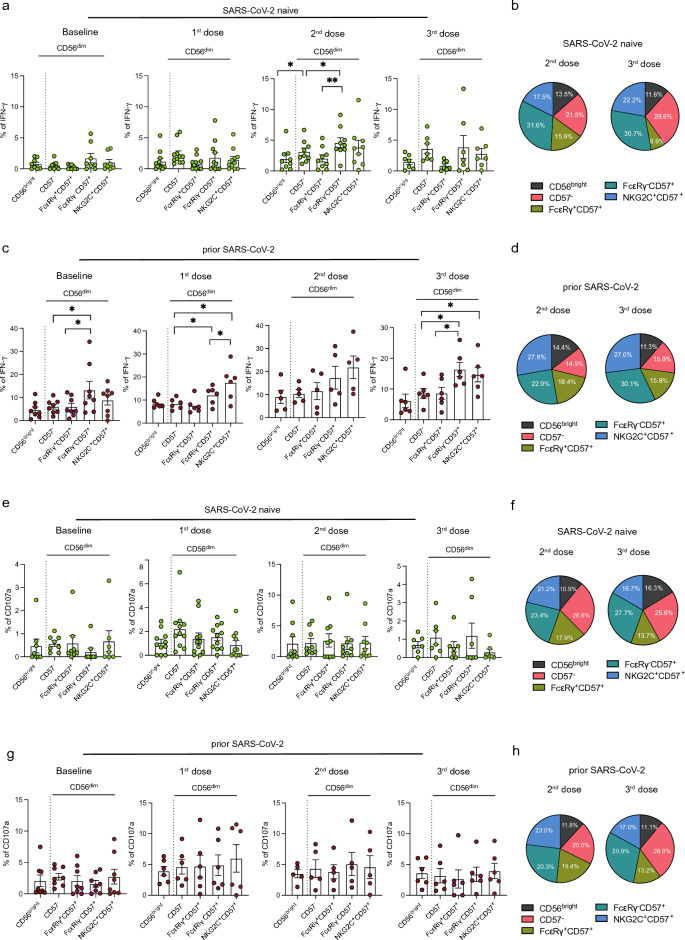
Figure 4.
Antibody-dependent responses of different NK cell subsets in PLWH. (a) Summary analysis and (b) pie charts showing the percentage of IFN-γ+ within CD56bright, CD56dimCD57−, CD56dimCD57+FcεRIγ+, CD56dimCD57+FcεRIγ−, and CD56dimCD57+NKG2C+ cells in SARS-CoV-2 naïve PLWH at baseline and after one, two or three doses of vaccine (as indicated above each figure). NK cell subsets in the pie chart are color-coded in the key. (a) Summary analysis and (b) pie charts showing the percentage of IFN-γ+ within different NK cell subsets in PLWH with prior SARS-CoV-2 infection. (e) Summary analysis and (f) pie charts showing the percentage of CD107a+ within different NK cell subsets in SARS-CoV-2 naïve PLWH at baseline and after each vaccine dose. (g) Summary analysis and (h) pie charts representing the frequencies of CD107a+ within different NK cell subsets in PLWH with prior SARS-CoV-2 infection. Significance determined by two-tailed Wilcoxon-signed rank test [(a), (c), (e), (g)]; * p < 0.05, ** p < 0.01. Data are represented as geometric mean ± SEM [(a), (c), (e), (g)]. See also Supplementary Fig. 4.

