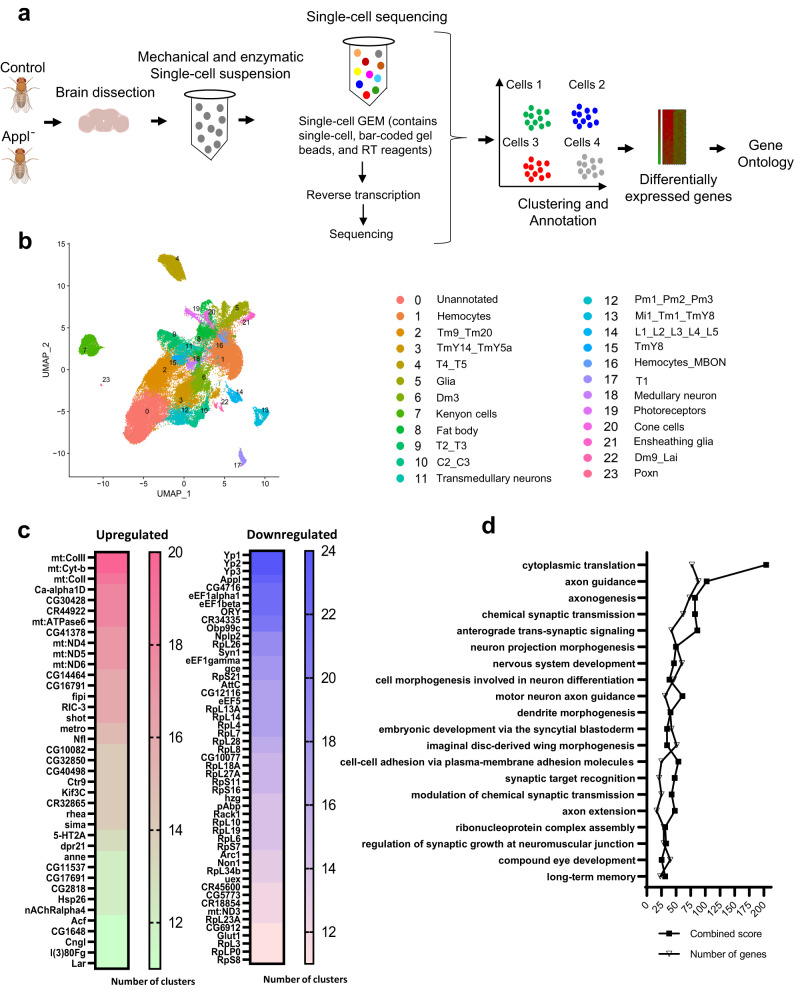
Fig. 2. Single-cell RNA-sequencing in Drosophila brains with loss of Appl.
a Schematic of study design for single-cell RNA sequencing (scRNA-seq). Created with BioRender.com. b UMAP plot of scRNA-seq data from the fly brain shows clusters of neuronal and non-neuronal cell populations. Each color represents a distinct cell cluster as indicated. c Genes upregulated and downregulated in more than 10 cell clusters are shown. The given numbers represent the number of clusters with differential expression of the corresponding gene. d Gene ontology analysis of differentially expressed genes using FlyEnrichr categorizes genes under the biological process. The p-value is computed using Fisher’s exact test, a binomial proportion test assuming a binomial distribution. The combined score was calculated by combining the z-score and p-value using the formula c = ln(p) * z. Source data are provided as a Source Data file.

