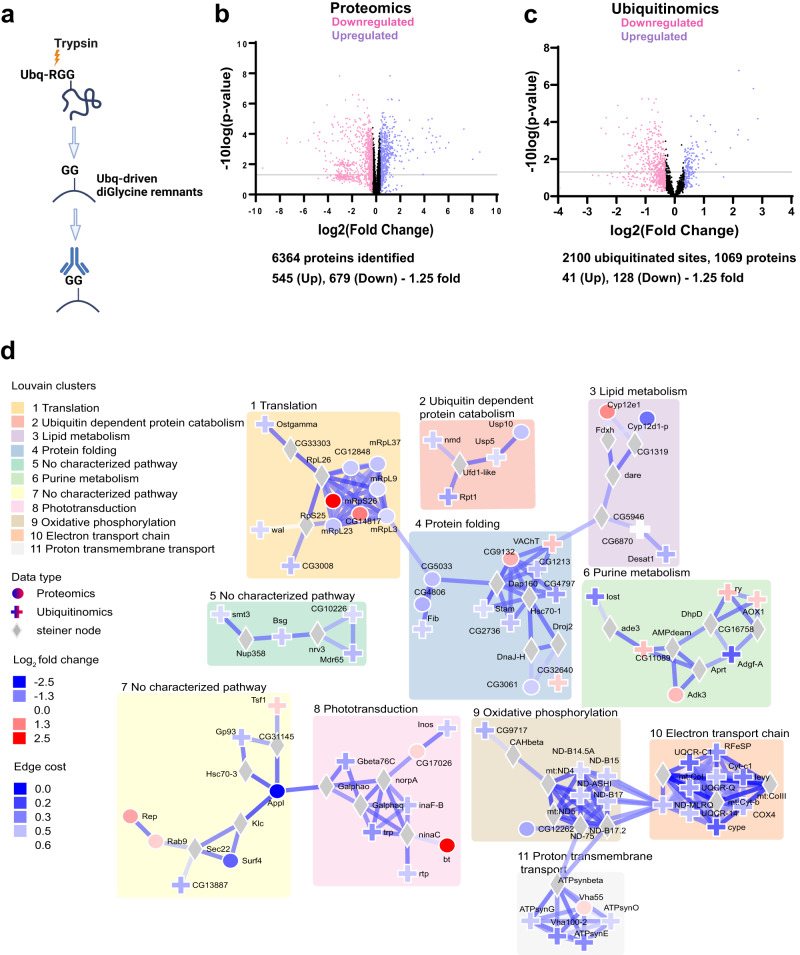
Fig. 3. Proteome, ubiquitinome and integrative analysis of flies with loss of Appl.
a Schematic of enrichment procedure for ubiquitinated proteins using the diglycine antibody, which targets the GG remnants of ubiquitinated regions following trypsin digestion. Created with BioRender.com. b Volcano plot showing the distribution of proteins in the whole proteome analysis of Appl deleted flies. Protein level changes greater than 1.25-fold are indicated as pink and violet dots. Violet dots indicate upregulated proteins; pink dots indicate down-regulated proteins. The grey line marks False Discovery Rate (FDR) adjusted two-tailed p-value = 0.05. Proteins indicated by dots below that line are not considered statistically significant. c Volcano plot showing the distribution of ubiquitinated proteins in Appl deleted flies. DiGlycine peptide changes, indicating ubiquitination, above 1.25-fold, are indicated as pink and violet dots. Violet dots indicate upregulated proteins; pink dots indicate down-regulated proteins. The grey line marks False Discovery Rate (FDR) adjusted two-tailed p-value = 0.05. Proteins indicated by dots below that line are not considered statistically significant. d Protein networks altered by removing Appl. Louvain clustering of proteins altered in proteome and ubiquitinome analysis of flies without Appl show enrichment of proteostasis-related networks such as translation, protein folding, and ubiquitin-dependent degradation. Shapes of the nodes show the source of protein. Steiner nodes are the proteins that are not experimentally altered; however, they are predicted to be associated with loss of Appl. Results from single-cell RNA sequencing data were used to adjust edge confidence and node weights in the network. The cost of the edges is determined by the confidence in the protein-protein interaction as calculated by STRING. These edges were weighted by the number of single cell clusters with altered candidate gene expression. A lower cost indicates greater confidence in the protein-protein interaction. Source data are provided as a Source Data file.

