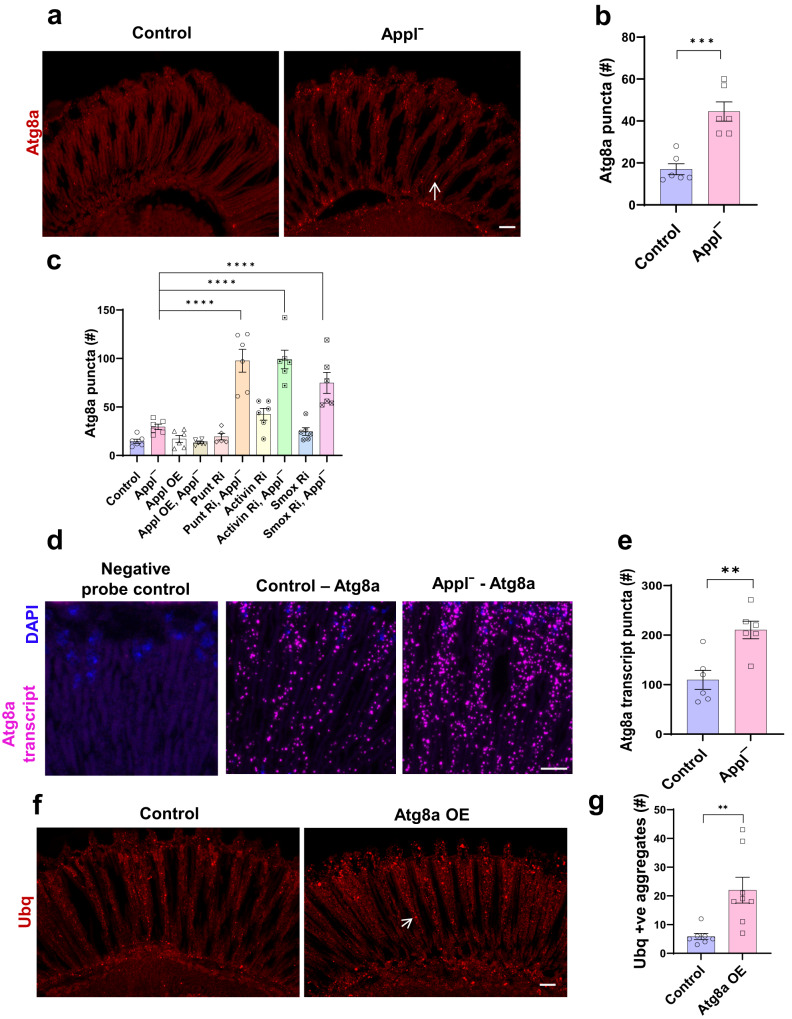
Fig. 6. Appl loss alters the autophagy pathway.
a Representative immunofluorescent image shows increased numbers of Atg8a-positive puncta (arrow) in Applˉ mutants compared to control flies. b Quantitative analysis shows significant increase in Atg8a-immunoreactive puncta in retinal sections from Applˉ flies compared to controls. p-value (Control vs Applˉ) = 0.0008. c Quantitative analysis indicates the number of Atg8a-immunoreactive puncta in retinal sections from flies expressing Drosophila Appl or transgenic RNAi directed to TGFβ components in retinal neurons. p-values for Applˉ vs punt Ri, Applˉ, Applˉ vs Activin Ri, Applˉ, and Applˉ vs Smox Ri, Applˉ are <0.0001. d Representative RNAi in situ (RNAScope) images show increased Atg8a mRNA (magenta) in the Applˉ retina compared to control. DAPI (blue) shows nuclei. e Quantitative analysis shows significantly increased Atg8a transcript levels in Applˉ mutants compared to controls. p-value (Control vs Applˉ) = 0.0031. f Representative immunofluorescent staining shows ubiquitin-positive aggregates (arrow) in flies overexpressing Atg8a (Atg8a OE) in neurons. g Quantitative analysis shows significantly increased numbers of ubiquitin-positive aggregates in sections of flies overexpressing Atg8a in retinal neurons. Control n = 7, Applˉ n = 8. p-value (Control vs Atg8a OE) = 0.0079. Control is nSyb-GAL4/+. **p < 0.01, ***p < 0.001, ****p < 0.0001 two-tailed Student’s t-test (b, e, g) or one-way ANOVA with Student-Newman-Keuls posthoc test (c). Data are represented as mean ± SEM. n = 6 per genotype (b, c, e). Scale bars are 10 μm. Flies are 10 days old. Source data are provided as a Source Data file.

